
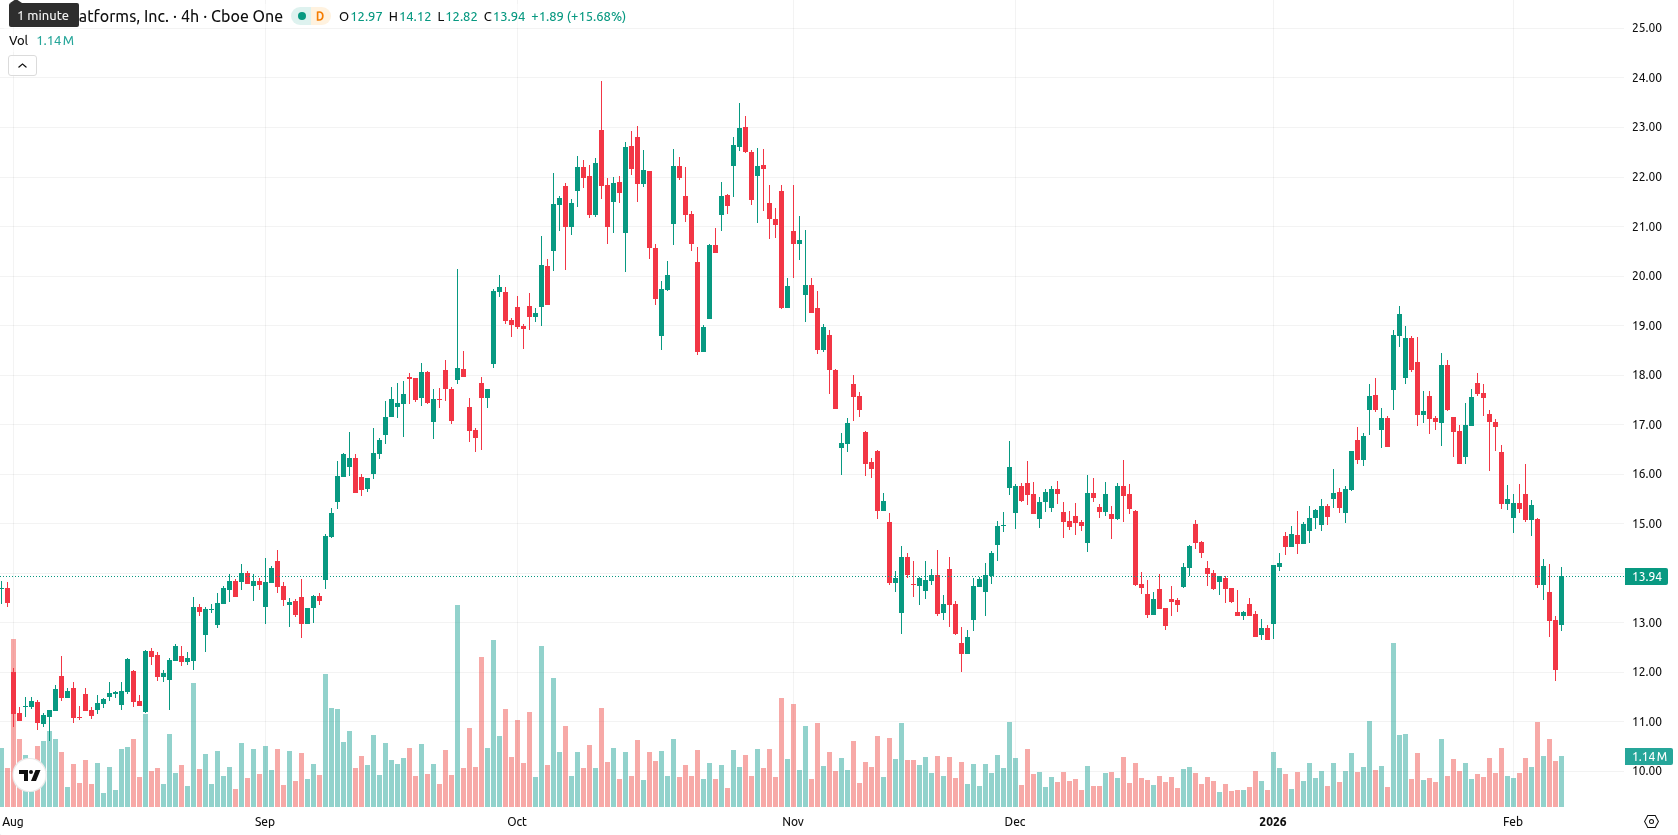
+15.5% for Riot Platforms stock — breakout testing resistance zones after prolonged weakness

Riot Platforms (RIOT, formerly Riot Blockchain) is trading at $13.93, holding below the MA-20 at $16.35 and the MA-50 at $15.23, but narrowly under the MA-200 at $13.99, signaling persistent short- and medium-term seller pressure, while the long-term trend is close to inflection.
Highlights
- Riot Platforms closed at $13.93, trading below the MA-20 ($16.35), MA-50 ($15.23), and narrowly under MA-200 ($13.99), indicating persistent seller pressure.
- Short-term momentum remains weak, with RSI at 32.14 and Stochastic RSI and CCI deeply oversold, despite a 15.50% rebound and high intraday volatility.
- Key levels for the next five days are $12.50 (support) and $15.50 (resistance), with less than 20% probability of a sustained price increase.
Weak support and mixed momentum sustain downside pressure
The nearest dynamic resistance sits at the Ichimoku Kijun of $15.59, suggesting this level as the immediate upside cap, while support is weakly defined just below the current price around the MA-200. Momentum signals remain mixed: on the daily timeframe, MACD and ADX are neutral, but intraday indicators show weakness. RSI is at 32.14, Stochastic RSI and CCI both register oversold, and Bull/Bear Power shows persistent seller dominance, highlighting prevailing downside pressure. The Awesome Oscillator also supports the overall bearish structure.
Narrow trading range expected as upside is capped
Looking ahead, the expected price range for the next 5 trading days is $12.50 to $15.50, normalizing for the current price and underlying volatility. The probability of a price increase is very low (less than 20%), making a decline more likely in the near term. The baseline scenario is for the share to remain in a sideways corridor between $12.50 support and $15.50 resistance, as mixed signals from weekly MACD and persistent selling pressure dominate. A bullish scenario would be triggered if the price breaks decisively above $15.59, targeting resistance near $16.50, while a bearish scenario could see the price lose support near $12.50 and test lower levels around $12.00.
Previously it was reported that RIOT rebounded strongly but continues to trade below its 20-, 50-, and 200-day moving averages, reflecting persistent selling pressure across all timeframes amid heightened volatility. Technical indicators, including a deeply oversold RSI and neutral MACD, suggest seller dominance remains, with key support near $13.00 and resistance at $15.59, even as short-term momentum shows signs of recovery.


-
 Afghanistan
-
 Albania
-
 Algeria
-
 Angola
-
 Argentina
-
 Armenia
-
 Australia
-
 Austria
-
 Azerbaijan
-
 Bahamas
-
 Bahrain
-
 Bangladesh
-
 Belarus
-
 Belgium
-
 Bolivia
-
 Botswana
-
 Brazil
-
 Brunei
-
 Bulgaria
-
 Cambodia
-
 Cameroon
-
 Canada
-
 Chile
Chile
-
 China
China
-
 Colombia
-
 Congo
Congo
-
 Costa Rica
-
 Cote d'Ivoire
-
 Croatia
-
 Cuba
Cuba
-
 Cyprus
-
 Czechia
-
 DR Congo
-
 Denmark
-
 Dominican Republic
-
 Ecuador
-
 Egypt
Egypt
-
 El Salvador
-
 Estonia
-
 Eswatini
-
 Ethiopia
-
 Finland
-
 France
-
 Georgia
-
 Germany
-
 Ghana
Ghana
-
 Greece
-
 Haiti
Haiti
-
 Hong Kong
-
 Hungary
-
 India
India
-
 Indonesia
-
 Iran, Islamic republic
-
 Iraq
Iraq
-
 Ireland
-
 Israel
-
 Italy
Italy
-
 Jamaica
-
 Japan
Japan
-
 Jordan
-
 Kazakhstan
-
 Kenya
Kenya
-
 Korea
Korea
-
 Kuwait
-
 Kyrgyzstan
-
 Laos
Laos
-
 Latvia
-
 Lebanon
-
 Lesotho
-
 Libya
Libya
-
 Lithuania
-
 Luxembourg
-
 Madagascar
-
 Malaysia
-
 Malta
Malta
-
 Mauritius
-
 Mexico
-
 Moldova
-
 Mongolia
-
 Montenegro
-
 Morocco
-
 Mozambique
-
 Myanmar
-
 Namibia
-
 Nepal
Nepal
-
 Netherlands
-
 New Zealand
-
 Nigeria
-
 North Macedonia
-
 Norway
-
 Oman
Oman
-
 Pakistan
-
 Palestine
-
 Panama
-
 Papua New Guinea
-
 Paraguay
-
 Peru
Peru
-
 Philippines
-
 Poland
-
 Portugal
-
 Puerto Rico
-
 Qatar
Qatar
-
 Reunion
-
 Romania
-
 Rwanda
-
 Saudi Arabia
-
 Serbia
-
 Singapore
-
 Slovakia
-
 Slovenia
-
 Somalia
-
 South Africa
-
 Spain
Spain
-
 Sri Lanka
-
 Sweden
-
 Switzerland
-
 Syria
Syria
-
 Taiwan
-
 Tajikistan
-
 Tanzania
-
 Thailand
-
 Trinidad and Tobago
-
 Tunisia
-
 Turkey
-
 UAE
UAE
-
 Uganda
-
 Ukraine
-
 United Kingdom
-
United States
-
 Uruguay
-
 Uzbekistan
-
 Venezuela
-
 Vietnam
-
 Yemen
Yemen
-
 Zambia
-
 Zimbabwe
- Forex
- Crypto
