
+19.14% for CleanSpark stock — oversold technicals and late-session buying drive rebound

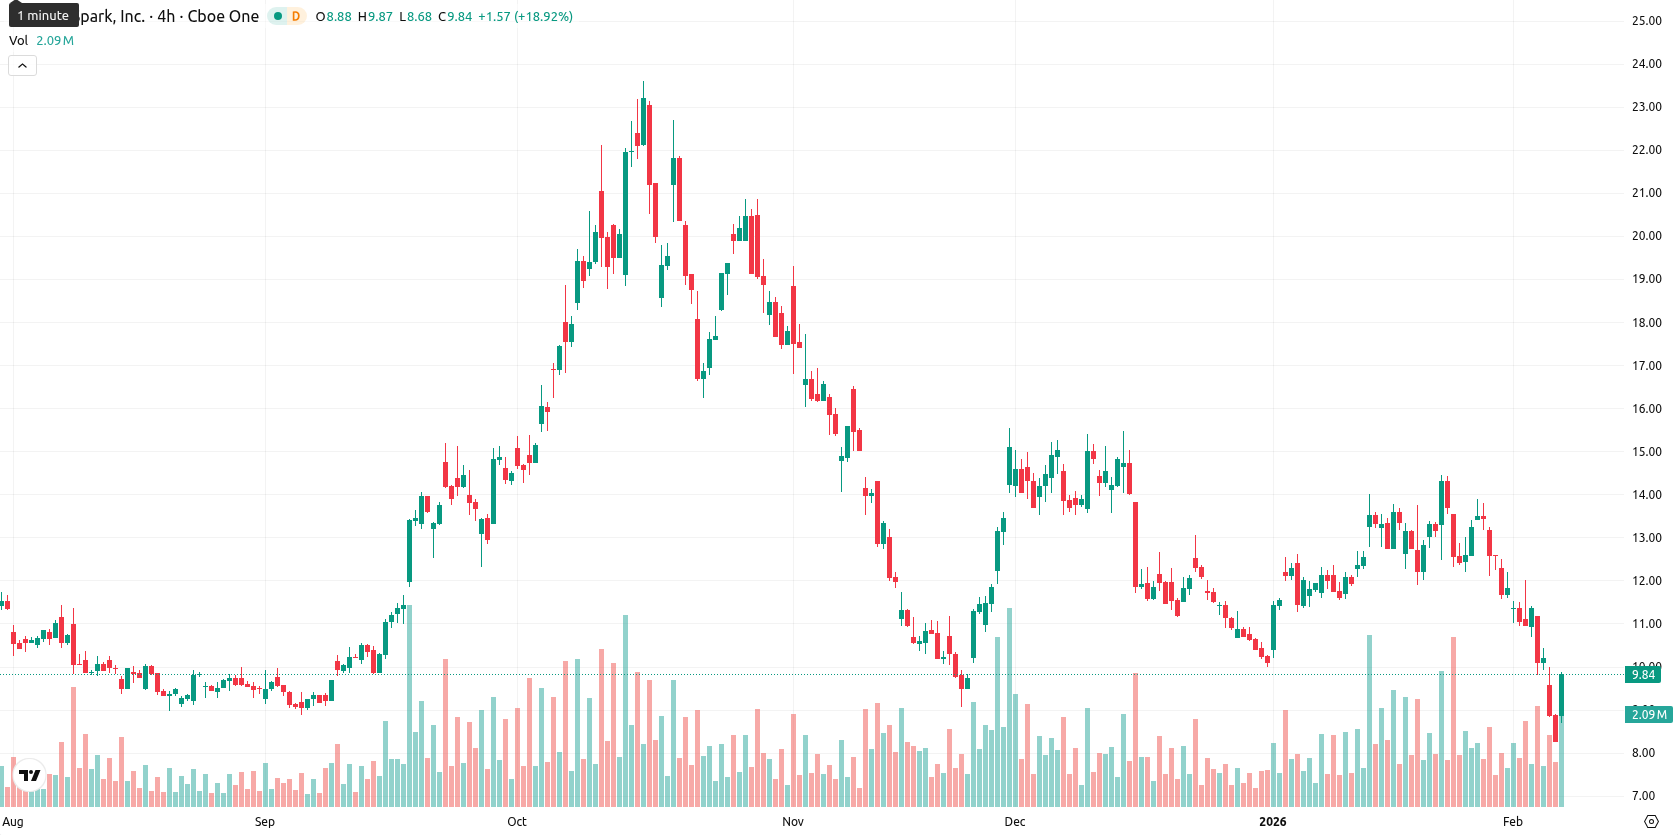
CleanSpark, Inc. (CLSK) is trading at $9.85 after jumping 19.14% during the session, yet remains below the MA-20 at $12.22, MA-50 at $12.46, and MA-200 at $12.11. This alignment signals strong underlying bearish pressure across short-, medium-, and long-term timeframes.
Highlights
- CleanSpark reported Q1 FY26 revenue of $181.2 million, up 11.6% year-over-year but missing consensus by $13 million, with a net loss of $378.7 million.
- The company expanded infrastructure, securing up to 890 MW of power in Houston and acquiring land for AI-focused data center development to diversify beyond bitcoin mining.
- CLSK trades at $9.85 below key moving averages, with technicals indicating oversold conditions and a likely consolidation in the $9.40–$10.80 range amid bearish momentum.
Revenue miss and widening losses as diversification efforts accelerate
CleanSpark reported first quarter fiscal 2026 results with revenues of $181.2 million, up 11.6% year-over-year but below consensus by about $13 million. The company posted a net loss of $378.7 million and a significant adjusted EBITDA loss of $295.4 million versus a positive result a year ago. Infrastructure was expanded, with up to 890 megawatts of utility-grade power secured in Houston and additional land acquired for AI-focused data center growth. Management also highlighted a strategic move toward multi-stream infrastructure, aiming to diversify revenue beyond bitcoin mining.
Resistance and negative momentum persist amid intense selling pressure
The technical backdrop for CLSK remains weak as price action is capped by the Ichimoku Kijun resistance at $11.35, with immediate support found in the $9.40–$9.50 zone above the Hull Moving Average. Indicators such as the MACD and ADX show a lack of positive momentum, while the RSI, Stochastic RSI, and CCI reflect pronounced oversold conditions. Bull/Bear Power signals continued dominance by sellers, and although the price is testing session highs within the $8.71–$9.85 intraday volatility band, late buying is clashing with overall negative momentum.
Limited breakout odds as fragile setup favors consolidation
Over the next five sessions, CLSK is likely to consolidate within a typical volatility band of $9.40 to $10.80. The chance of a near-term upside breakout is low — less than 20% — and the bias remains toward sideways or lower movement. A push above $10.80 would be required to signal a bullish scenario toward $11.35, while losing $9.40 support could expose further downside. The fragile technical setup calls for caution despite the session’s sharp rebound.
Last time, analysts noted that CleanSpark Inc. remains under sustained bearish pressure, with its price decisively below all key moving averages and technical indicators such as MACD and ADX signaling weak momentum and a lack of directional strength. The current rally shows strong intraday volatility and short-term buying interest, but sellers retain control as no substantial support is evident above current levels, underscoring a divergence between short-term gains and long-term bearish trends.


Latest CleanSpark News


-
 Afghanistan
-
 Albania
-
 Algeria
-
 Angola
-
 Argentina
-
 Armenia
-
 Australia
-
 Austria
-
 Azerbaijan
-
 Bahamas
-
 Bahrain
-
 Bangladesh
-
 Belarus
-
 Belgium
-
 Bolivia
-
 Botswana
-
 Brazil
-
 Brunei
-
 Bulgaria
-
 Cambodia
-
 Cameroon
-
 Canada
-
 Chile
Chile
-
 China
China
-
 Colombia
-
 Congo
Congo
-
 Costa Rica
-
 Cote d'Ivoire
-
 Croatia
-
 Cuba
Cuba
-
 Cyprus
-
 Czechia
-
 DR Congo
-
 Denmark
-
 Dominican Republic
-
 Ecuador
-
 Egypt
Egypt
-
 El Salvador
-
 Estonia
-
 Eswatini
-
 Ethiopia
-
 Finland
-
 France
-
 Georgia
-
 Germany
-
 Ghana
Ghana
-
 Greece
-
 Haiti
Haiti
-
 Hong Kong
-
 Hungary
-
 India
India
-
 Indonesia
-
 Iran, Islamic republic
-
 Iraq
Iraq
-
 Ireland
-
 Israel
-
 Italy
Italy
-
 Jamaica
-
 Japan
Japan
-
 Jordan
-
 Kazakhstan
-
 Kenya
Kenya
-
 Korea
Korea
-
 Kuwait
-
 Kyrgyzstan
-
 Laos
Laos
-
 Latvia
-
 Lebanon
-
 Lesotho
-
 Libya
Libya
-
 Lithuania
-
 Luxembourg
-
 Madagascar
-
 Malaysia
-
 Malta
Malta
-
 Mauritius
-
 Mexico
-
 Moldova
-
 Mongolia
-
 Montenegro
-
 Morocco
-
 Mozambique
-
 Myanmar
-
 Namibia
-
 Nepal
Nepal
-
 Netherlands
-
 New Zealand
-
 Nigeria
-
 North Macedonia
-
 Norway
-
 Oman
Oman
-
 Pakistan
-
 Palestine
-
 Panama
-
 Papua New Guinea
-
 Paraguay
-
 Peru
Peru
-
 Philippines
-
 Poland
-
 Portugal
-
 Puerto Rico
-
 Qatar
Qatar
-
 Reunion
-
 Romania
-
 Rwanda
-
 Saudi Arabia
-
 Serbia
-
 Singapore
-
 Slovakia
-
 Slovenia
-
 Somalia
-
 South Africa
-
 Spain
Spain
-
 Sri Lanka
-
 Sweden
-
 Switzerland
-
 Syria
Syria
-
 Taiwan
-
 Tajikistan
-
 Tanzania
-
 Thailand
-
 Trinidad and Tobago
-
 Tunisia
-
 Turkey
-
 UAE
UAE
-
 Uganda
-
 Ukraine
-
 United Kingdom
-
United States
-
 Uruguay
-
 Uzbekistan
-
 Venezuela
-
 Vietnam
-
 Yemen
Yemen
-
 Zambia
-
 Zimbabwe
- Forex
- Crypto
