
Quantum Computing stock price forecast: Bearish outlook continues as QUBT slides below key moving averages

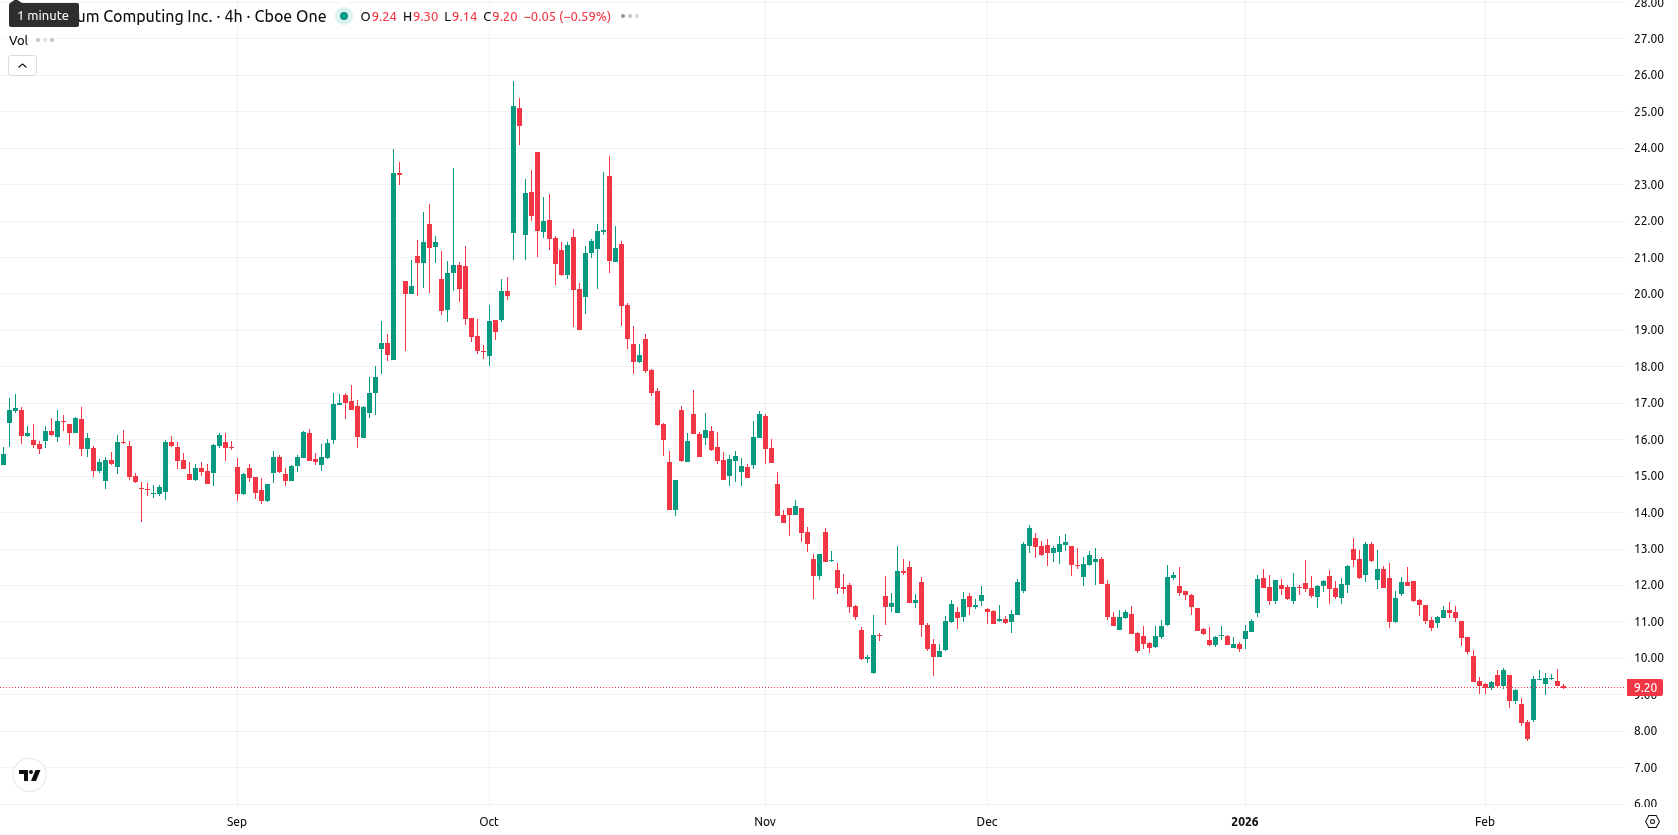
Quantum Computing Inc. (QUBT) is trading at $9.10 after slipping 3.65% today. The asset sits below short-, medium-, and long-term moving averages (MA-20 at $10.79, MA-50 at $11.29, MA-200 at $14.35), underscoring persistent selling momentum and a sustained bearish trend.
Highlights
- QUBT trades at $9.10, remaining below the MA-20 ($10.79), MA-50 ($11.29), and MA-200 ($14.35), signaling sustained multi-term selling pressure.
- Momentum indicators such as MACD (sell bias), weak ADX, RSI (42.50), and oversold oscillators confirm a bearish environment with moderate volatility.
- QUBT faces resistance near $10.51 (Ichimoku Kijun) and potential support at $8.67 (Hull MA); projected range over the next five sessions is $8.95–$9.75.
Sellers dominate as resistance holds and momentum remains weak
Technically, QUBT faces strong resistance near the Ichimoku Kijun level at $10.51, with minor support at the Hull Moving Average around $8.67. All major trend indicators signal weakness: the MACD maintains a sell bias, the ADX shows a weak trend, and intraday oscillators (RSI at 42.50, Commodity Channel Index, Stochastic RSI) reflect an oversold and bearish environment. Bull/Bear Power is decisively negative, confirming sellers' dominance, while the Awesome Oscillator remains neutral.
Limited rebound odds as downside bias and volatility persist
In the short term, QUBT is expected to remain in a volatility band from $8.95 to $9.75 over the next five trading days, with a continued bias to the downside as weekly indicators point to further weakness. The likelihood of a sustained rebound is low (less than 20%), though oversold readings could produce brief relief rallies. Sustained upside would require a decisive break above $10.51, while a move below $8.95 may open the way for further declines. Most scenarios suggest price consolidation near current levels amid moderate volatility.
Previously it was reported that Quantum Computing Inc. (QUBT) is exhibiting sustained bearish momentum, trading below all major moving averages with key technical indicators such as MACD, RSI, and CCI signaling ongoing downside pressure. The stock faces dynamic resistance at the Ichimoku Kijun level and remains under seller control, as confirmed by intraday trading near session lows and negative momentum signals.


Latest Quantum Computing News


-
 Afghanistan
-
 Albania
-
 Algeria
-
 Angola
-
 Argentina
-
 Armenia
-
 Australia
-
 Austria
-
 Azerbaijan
-
 Bahamas
-
 Bahrain
-
 Bangladesh
-
 Belarus
-
 Belgium
-
 Bolivia
-
 Botswana
-
 Brazil
-
 Brunei
-
 Bulgaria
-
 Cambodia
-
 Cameroon
-
 Canada
-
 Chile
Chile
-
 China
China
-
 Colombia
-
 Congo
Congo
-
 Costa Rica
-
 Cote d'Ivoire
-
 Croatia
-
 Cuba
Cuba
-
 Cyprus
-
 Czechia
-
 DR Congo
-
 Denmark
-
 Dominican Republic
-
 Ecuador
-
 Egypt
Egypt
-
 El Salvador
-
 Estonia
-
 Eswatini
-
 Ethiopia
-
 Finland
-
 France
-
 Georgia
-
 Germany
-
 Ghana
Ghana
-
 Greece
-
 Haiti
Haiti
-
 Hong Kong
-
 Hungary
-
 India
India
-
 Indonesia
-
 Iran, Islamic republic
-
 Iraq
Iraq
-
 Ireland
-
 Israel
-
 Italy
Italy
-
 Jamaica
-
 Japan
Japan
-
 Jordan
-
 Kazakhstan
-
 Kenya
Kenya
-
 Korea
Korea
-
 Kuwait
-
 Kyrgyzstan
-
 Laos
Laos
-
 Latvia
-
 Lebanon
-
 Lesotho
-
 Libya
Libya
-
 Lithuania
-
 Luxembourg
-
 Madagascar
-
 Malaysia
-
 Malta
Malta
-
 Mauritius
-
 Mexico
-
 Moldova
-
 Mongolia
-
 Montenegro
-
 Morocco
-
 Mozambique
-
 Myanmar
-
 Namibia
-
 Nepal
Nepal
-
 Netherlands
-
 New Zealand
-
 Nigeria
-
 North Macedonia
-
 Norway
-
 Oman
Oman
-
 Pakistan
-
 Palestine
-
 Panama
-
 Papua New Guinea
-
 Paraguay
-
 Peru
Peru
-
 Philippines
-
 Poland
-
 Portugal
-
 Puerto Rico
-
 Qatar
Qatar
-
 Reunion
-
 Romania
-
 Rwanda
-
 Saudi Arabia
-
 Serbia
-
 Singapore
-
 Slovakia
-
 Slovenia
-
 Somalia
-
 South Africa
-
 Spain
Spain
-
 Sri Lanka
-
 Sweden
-
 Switzerland
-
 Syria
Syria
-
 Taiwan
-
 Tajikistan
-
 Tanzania
-
 Thailand
-
 Trinidad and Tobago
-
 Tunisia
-
 Turkey
-
 UAE
UAE
-
 Uganda
-
 Ukraine
-
 United Kingdom
-
United States
-
 Uruguay
-
 Uzbekistan
-
 Venezuela
-
 Vietnam
-
 Yemen
Yemen
-
 Zambia
-
 Zimbabwe
- Forex
- Crypto
