
Intuit drops 5.07% as RSI and MACD confirm deep oversold conditions, resistance at $534.46 – weekly analysis

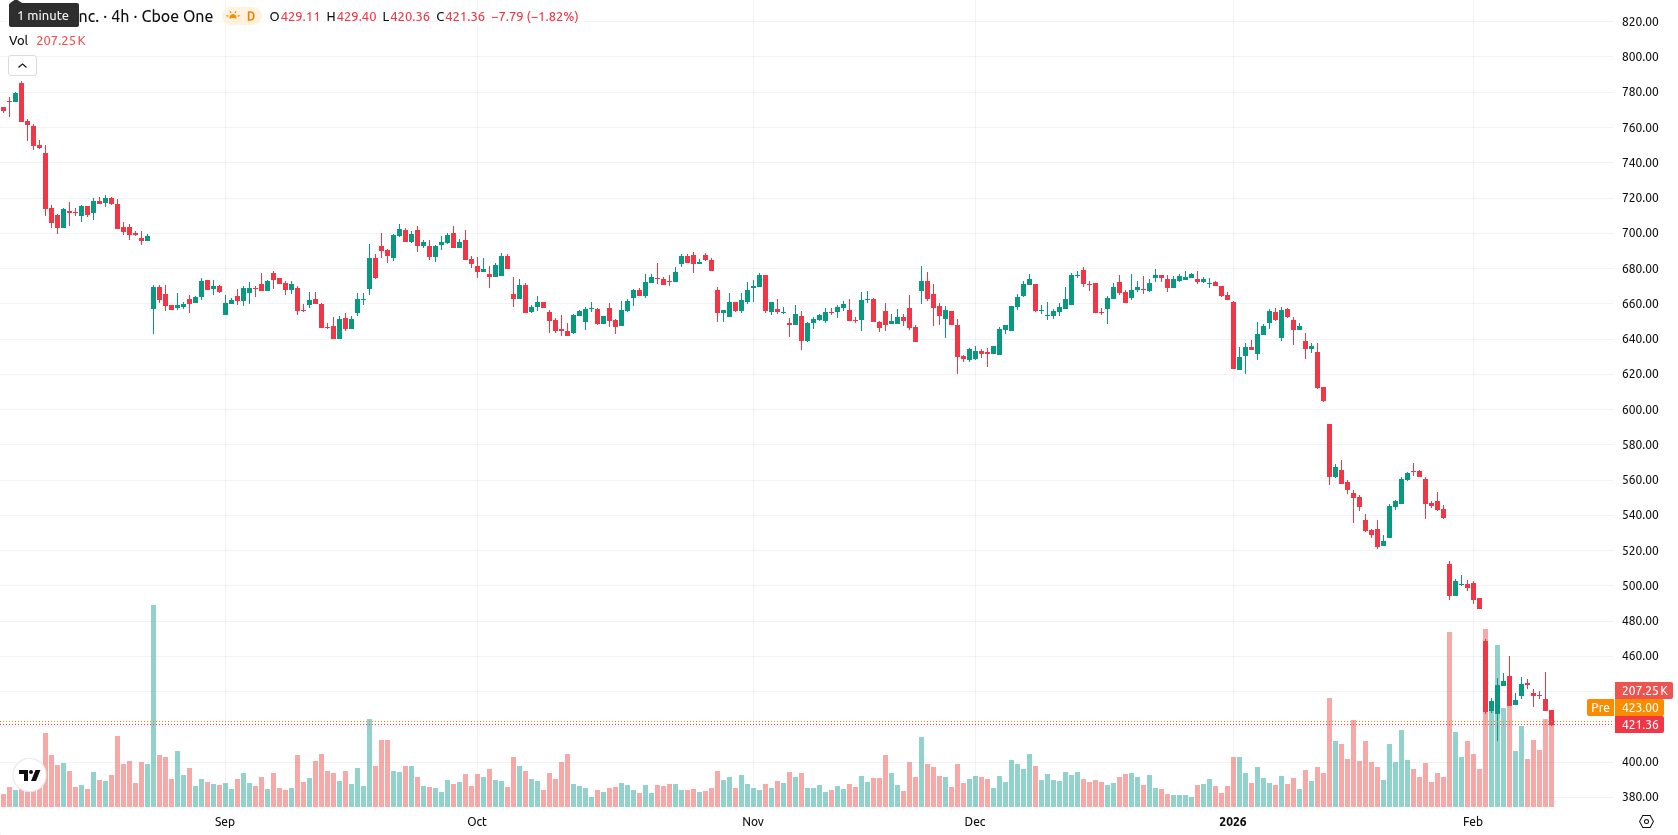
Intuit Inc. (INTU) is trading at $421.27, marking a significant weekly drop as the stock remains well below its key W1 moving averages: MA-20 at $509.44, MA-50 at $598.49, and MA-200 at $675.45. This positioning underscores a continued seller-dominated trend, with INTU closing the week deep in oversold territory and under pronounced downside pressure.
Highlights
- INTU is trading at $421.27, significantly below the MA-20 ($509.44), MA-50 ($598.49), and MA-200 ($675.45), signaling entrenched bearish momentum across all timeframes.
- Oversold technical readings—RSI, Stochastic RSI, and CCI—combined with bearish MACD and ADX, indicate persistent seller control and minimal probability of a near-term reversal.
- Expected price range for the coming week is $400–$440, with resistance at $440 and a risk of decline below $400 if current selling pressure continues.
Platform expansion and partnerships drive strategic diversification this week
Intuit has rolled out new Mailchimp ecommerce product innovations to help merchants link data and power omnichannel marketing campaigns. The company also entered into an exclusive multi-year agreement to bring Affirm’s pay-over-time solution to QuickBooks Payments, expanding its footprint in ecommerce and payment services. These moves highlight INTU's ongoing push to diversify its platform offerings and strengthen its payments ecosystem.
Bearish momentum intensifies over the week amid extreme oversold signals
Weekly technicals remain strongly bearish, with INTU trading well below its MA-20, MA-50, and MA-200. The nearest resistance is around the Ichimoku Kijun at $534.46, while momentum indicators such as MACD and ADX confirm the bearish bias. RSI, Stochastic RSI, and CCI all point to oversold conditions, and Bull/Bear Power signals persistent seller dominance. The Awesome Oscillator offers no countertrend signals, reinforcing the negative sentiment.
Sideways to lower outlook next week as technical pressure persists
For the next week, the expected price range for INTU is $400–$440, reflecting recent volatility and the continued weight of technical selling. A sideways movement is the baseline scenario, but if sellers retain momentum, a further slide below $400 is possible. Upside prospects remain limited unless the stock can decisively break above $440, as all W1 momentum and trend indicators project ongoing bearishness.
Previously it was reported that Intuit Inc. continues to trade under sustained downward pressure, with its price well below all major moving averages and momentum oscillators indicating a strong bearish bias. With support levels being tested and volatility elevated, technical signals point to an increased probability of further downside, while rebound odds remain limited barring a decisive move above key resistance.


-
 Afghanistan
-
 Albania
-
 Algeria
-
 Angola
-
 Argentina
-
 Armenia
-
 Australia
-
 Austria
-
 Azerbaijan
-
 Bahamas
-
 Bahrain
-
 Bangladesh
-
 Belarus
-
 Belgium
-
 Bolivia
-
 Botswana
-
 Brazil
-
 Brunei
-
 Bulgaria
-
 Cambodia
-
 Cameroon
-
 Canada
-
 Chile
Chile
-
 China
China
-
 Colombia
-
 Congo
Congo
-
 Costa Rica
-
 Cote d'Ivoire
-
 Croatia
-
 Cuba
Cuba
-
 Cyprus
-
 Czechia
-
 DR Congo
-
 Denmark
-
 Dominican Republic
-
 Ecuador
-
 Egypt
Egypt
-
 El Salvador
-
 Estonia
-
 Eswatini
-
 Ethiopia
-
 Finland
-
 France
-
 Georgia
-
 Germany
-
 Ghana
Ghana
-
 Greece
-
 Haiti
Haiti
-
 Hong Kong
-
 Hungary
-
 India
India
-
 Indonesia
-
 Iran, Islamic republic
-
 Iraq
Iraq
-
 Ireland
-
 Israel
-
 Italy
Italy
-
 Jamaica
-
 Japan
Japan
-
 Jordan
-
 Kazakhstan
-
 Kenya
Kenya
-
 Korea
Korea
-
 Kuwait
-
 Kyrgyzstan
-
 Laos
Laos
-
 Latvia
-
 Lebanon
-
 Lesotho
-
 Libya
Libya
-
 Lithuania
-
 Luxembourg
-
 Madagascar
-
 Malaysia
-
 Malta
Malta
-
 Mauritius
-
 Mexico
-
 Moldova
-
 Mongolia
-
 Montenegro
-
 Morocco
-
 Mozambique
-
 Myanmar
-
 Namibia
-
 Nepal
Nepal
-
 Netherlands
-
 New Zealand
-
 Nigeria
-
 North Macedonia
-
 Norway
-
 Oman
Oman
-
 Pakistan
-
 Palestine
-
 Panama
-
 Papua New Guinea
-
 Paraguay
-
 Peru
Peru
-
 Philippines
-
 Poland
-
 Portugal
-
 Puerto Rico
-
 Qatar
Qatar
-
 Reunion
-
 Romania
-
 Rwanda
-
 Saudi Arabia
-
 Serbia
-
 Singapore
-
 Slovakia
-
 Slovenia
-
 Somalia
-
 South Africa
-
 Spain
Spain
-
 Sri Lanka
-
 Sweden
-
 Switzerland
-
 Syria
Syria
-
 Taiwan
-
 Tajikistan
-
 Tanzania
-
 Thailand
-
 Trinidad and Tobago
-
 Tunisia
-
 Turkey
-
 UAE
UAE
-
 Uganda
-
 Ukraine
-
 United Kingdom
-
United States
-
 Uruguay
-
 Uzbekistan
-
 Venezuela
-
 Vietnam
-
 Yemen
Yemen
-
 Zambia
-
 Zimbabwe
- Forex
- Crypto
