
-3.14% for Quantum Computing stock — no strong support as sellers stay in command

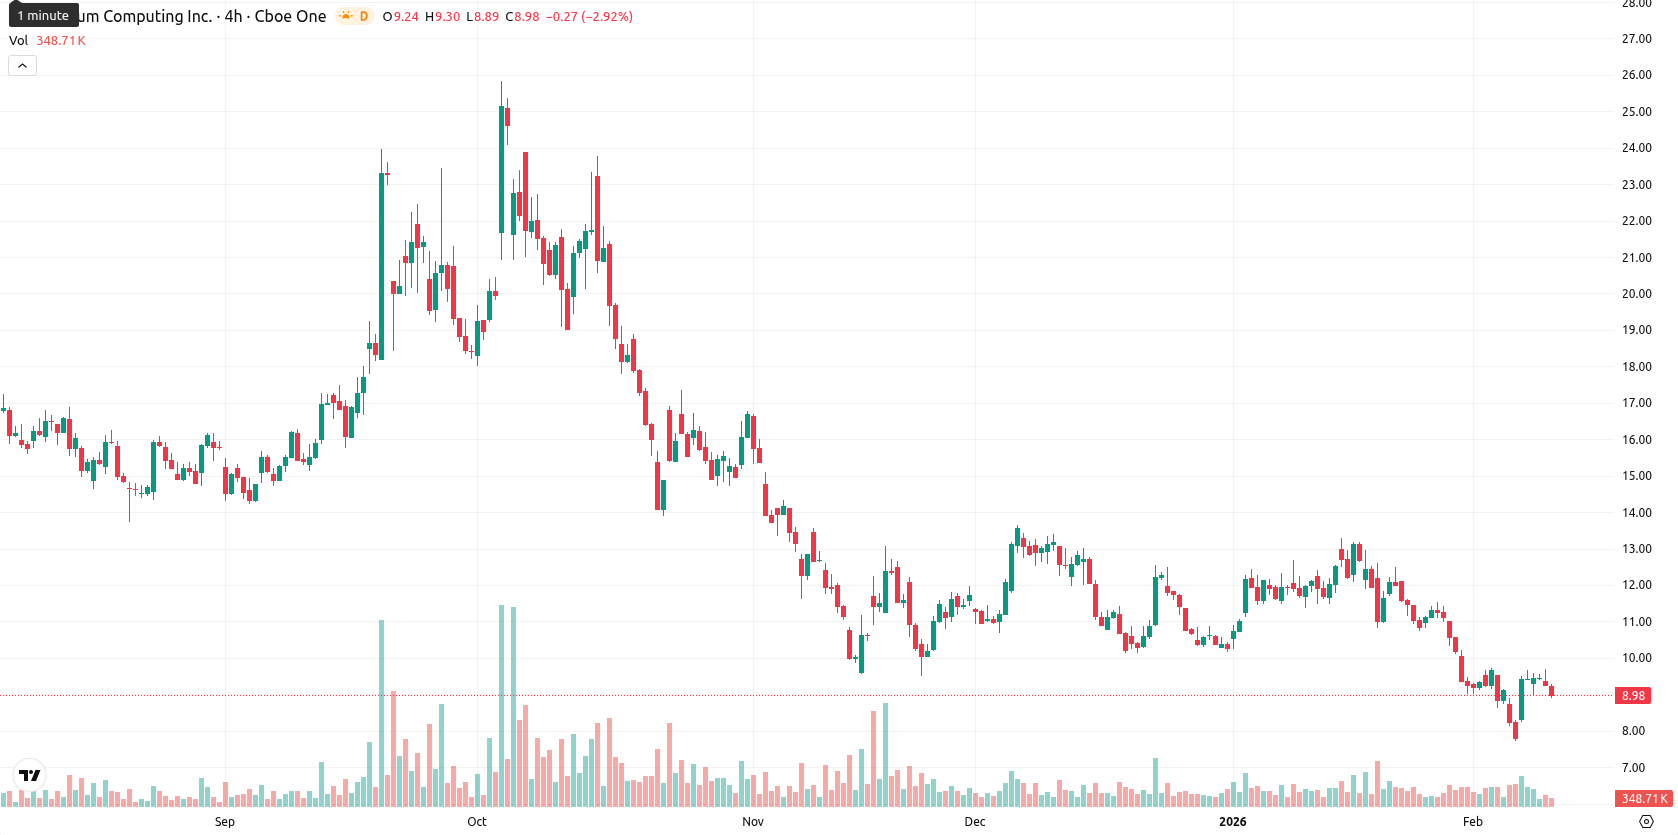
Quantum Computing Inc. (QUBT) is trading well below its MA-20 at $10.63, MA-50 at $11.24, and MA-200 at $14.36, signaling persistent downward pressure across all timeframes. The nearest dynamic resistance sits at the Ichimoku Kijun of $10.51, which remains well above the current price, underscoring the lack of nearby support for a recovery.
Highlights
- QUBT trades significantly below the MA-20 ($10.63), MA-50 ($11.24), and MA-200 ($14.36), confirming persistent bearish momentum across all timeframes.
- Momentum indicators including MACD, ADX, RSI, and Stochastic RSI all reflect weak trend strength and strong downside bias, with sellers controlling price action.
- QUBT is likely to consolidate between $8.50 and $9.60 over the next five days, with a break below $8.50 opening further downside risk.
Bearish momentum dominates as sellers control session and indicators align
Momentum signals are weak, with the MACD in bearish configuration and ADX indicating a neutral trend, pointing to limited upside strength and sustained downside bias. Bearish signals from the RSI, Stochastic RSI, CCI, and Bull/Bear Power confirm sellers remain dominant, while the Awesome Oscillator supports the prevailing downward momentum. QUBT opened with a minor gap higher before slipping 3.14% intraday to $8.68, now trading near the session low of $8.93 — reflecting heavy downside pressure amid moderate volatility. The opening bounce faded early, and sellers controlled the session throughout, matching the signals from technical indicators.
Limited rebound potential as bearish signals cap upside outlook
Looking ahead to the next five trading days, the price is expected to consolidate within a typical volatility band between $8.50 and $9.60, with less than a 20% chance of a sustained price increase due to the overwhelming bearish readings on weekly and daily indicators. The baseline scenario is for QUBT to hold in a tight corridor around current levels. A bullish scenario would see a move above $10.50 prompting short-covering, though such a shift appears unlikely without positive momentum. If the price breaks below $8.50, additional downside is probable as sellers retain clear control.
Previously it was reported that Quantum Computing Inc. trades below all key moving averages with technical indicators including MACD and RSI remaining bearish, while seller momentum and resistance at the Ichimoku Kijun line continue to limit upside. Oscillators signal persistent downside pressure and weak trend strength, suggesting limited rebound potential and likely continued consolidation barring a decisive move through current levels.


Latest Quantum Computing News


-
 Afghanistan
-
 Albania
-
 Algeria
-
 Angola
-
 Argentina
-
 Armenia
-
 Australia
-
 Austria
-
 Azerbaijan
-
 Bahamas
-
 Bahrain
-
 Bangladesh
-
 Belarus
-
 Belgium
-
 Bolivia
-
 Botswana
-
 Brazil
-
 Brunei
-
 Bulgaria
-
 Cambodia
-
 Cameroon
-
 Canada
-
 Chile
Chile
-
 China
China
-
 Colombia
-
 Congo
Congo
-
 Costa Rica
-
 Cote d'Ivoire
-
 Croatia
-
 Cuba
Cuba
-
 Cyprus
-
 Czechia
-
 DR Congo
-
 Denmark
-
 Dominican Republic
-
 Ecuador
-
 Egypt
Egypt
-
 El Salvador
-
 Estonia
-
 Eswatini
-
 Ethiopia
-
 Finland
-
 France
-
 Georgia
-
 Germany
-
 Ghana
Ghana
-
 Greece
-
 Haiti
Haiti
-
 Hong Kong
-
 Hungary
-
 India
India
-
 Indonesia
-
 Iran, Islamic republic
-
 Iraq
Iraq
-
 Ireland
-
 Israel
-
 Italy
Italy
-
 Jamaica
-
 Japan
Japan
-
 Jordan
-
 Kazakhstan
-
 Kenya
Kenya
-
 Korea
Korea
-
 Kuwait
-
 Kyrgyzstan
-
 Laos
Laos
-
 Latvia
-
 Lebanon
-
 Lesotho
-
 Libya
Libya
-
 Lithuania
-
 Luxembourg
-
 Madagascar
-
 Malaysia
-
 Malta
Malta
-
 Mauritius
-
 Mexico
-
 Moldova
-
 Mongolia
-
 Montenegro
-
 Morocco
-
 Mozambique
-
 Myanmar
-
 Namibia
-
 Nepal
Nepal
-
 Netherlands
-
 New Zealand
-
 Nigeria
-
 North Macedonia
-
 Norway
-
 Oman
Oman
-
 Pakistan
-
 Palestine
-
 Panama
-
 Papua New Guinea
-
 Paraguay
-
 Peru
Peru
-
 Philippines
-
 Poland
-
 Portugal
-
 Puerto Rico
-
 Qatar
Qatar
-
 Reunion
-
 Romania
-
 Rwanda
-
 Saudi Arabia
-
 Serbia
-
 Singapore
-
 Slovakia
-
 Slovenia
-
 Somalia
-
 South Africa
-
 Spain
Spain
-
 Sri Lanka
-
 Sweden
-
 Switzerland
-
 Syria
Syria
-
 Taiwan
-
 Tajikistan
-
 Tanzania
-
 Thailand
-
 Trinidad and Tobago
-
 Tunisia
-
 Turkey
-
 UAE
UAE
-
 Uganda
-
 Ukraine
-
 United Kingdom
-
United States
-
 Uruguay
-
 Uzbekistan
-
 Venezuela
-
 Vietnam
-
 Yemen
Yemen
-
 Zambia
-
 Zimbabwe
- Forex
- Crypto
