
-5.76% for Intuit stock — downside volatility and failed support trigger heavy losses

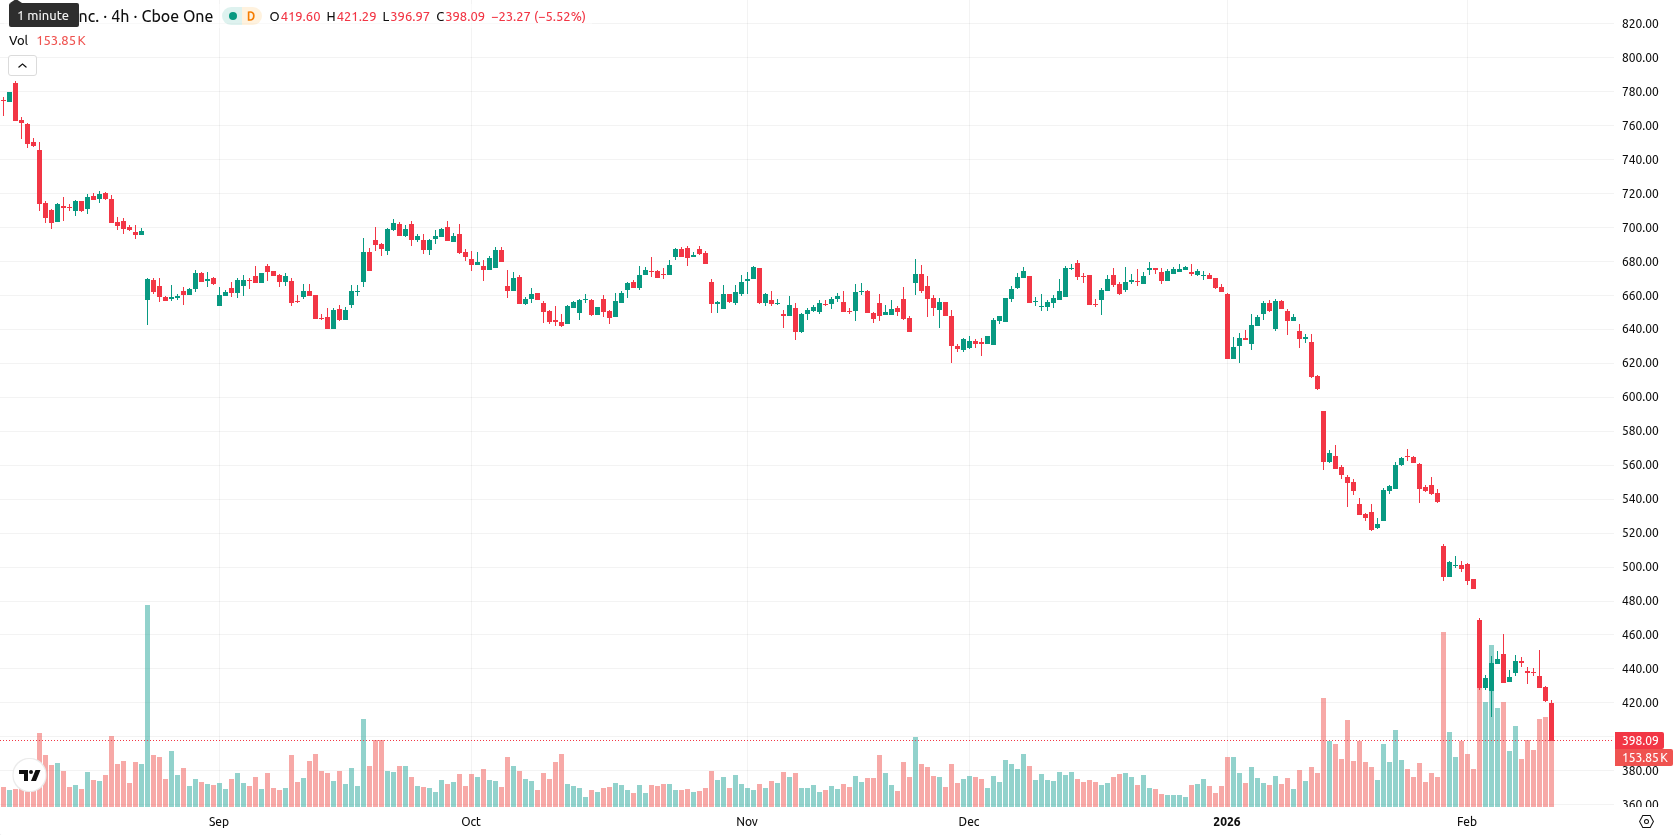
Intuit Inc. (INTU) is trading at $397.00, markedly below its MA-20 ($509.44), MA-50 ($598.49), and MA-200 ($675.45), confirming strong selling pressure across the short, medium, and long-term trends. The nearest dynamic level is the Ichimoku Kijun at $534.46, which now serves as major resistance given the deeply oversold price position.
Highlights
- Intuit launched an AI-native construction edition for its Enterprise Suite ERP platform, directly targeting mid-market construction businesses to enhance project, finance, and operations management.
- Mailchimp product innovations were introduced to improve ecommerce campaign effectiveness, while institutional investors like Johnson Investment Counsel Inc. and Rhumbline Advisers increased their holdings in Intuit stock.
- INTU trades at $397.00, well below key moving averages, with strong bearish momentum and high risk of further price declines toward the $380–$415 range.
Product launches and investor accumulation drive sentiment shift
Intuit has launched a new AI-native construction edition for its Enterprise Suite ERP platform, targeting mid-market construction businesses to enhance project, finance, and operations management. The company also rolled out new Mailchimp product innovations focused on improving ecommerce campaign effectiveness and sales connectivity. Additionally, institutional investors such as Johnson Investment Counsel Inc. and Rhumbline Advisers have reported increased holdings in Intuit stock.
Bearish momentum intensifies as volatility tests lower range
Momentum remains firmly bearish, as reflected by both the MACD and ADX signaling strong downward trends. Oversold readings from RSI, Stochastic RSI, and CCI on the daily chart highlight excessive selling and the potential for near-term technical rebounds, although Bull/Bear Power confirms sellers firmly dominate intraday activity. The Awesome Oscillator is neutral and does not add directional support; today’s session saw a notable gap down at the open with the price now hugging the lower end of the $400.36 – $420.70 range. Daily volatility is high, and the intraday tone is dominated by persistent downward pressure after the open, consistently in line with momentum signals.
Further downside risk persists as price consolidates near lows
Looking ahead to the next five trading days, we anticipate INTU to trade within a volatility band of approximately $380 to $415 relative to current levels. The probability of a further price decrease is very high (more than 80%), while the likelihood of a rebound remains very low. The baseline scenario calls for the stock to consolidate sideways in a depressed band near current levels. A move above resistance at $415 – $420 would be required for a bullish reversal, which is unlikely; a breakdown below $380 could expose INTU to further downside, with no substantial long-term support visible until significantly lower levels.
Previously it was reported that Intuit Inc. closed the week deep in oversold territory at $421.27, trading well below its key weekly moving averages, with technical indicators such as MACD, RSI, and ADX signaling intensified bearish momentum and persistent seller dominance. Resistance is seen near $534, and unless the stock breaks decisively above $440, technical pressure suggests a continued sideways to lower outlook with a risk of further downside.


-
 Afghanistan
-
 Albania
-
 Algeria
-
 Angola
-
 Argentina
-
 Armenia
-
 Australia
-
 Austria
-
 Azerbaijan
-
 Bahamas
-
 Bahrain
-
 Bangladesh
-
 Belarus
-
 Belgium
-
 Bolivia
-
 Botswana
-
 Brazil
-
 Brunei
-
 Bulgaria
-
 Cambodia
-
 Cameroon
-
 Canada
-
 Chile
Chile
-
 China
China
-
 Colombia
-
 Congo
Congo
-
 Costa Rica
-
 Cote d'Ivoire
-
 Croatia
-
 Cuba
Cuba
-
 Cyprus
-
 Czechia
-
 DR Congo
-
 Denmark
-
 Dominican Republic
-
 Ecuador
-
 Egypt
Egypt
-
 El Salvador
-
 Estonia
-
 Eswatini
-
 Ethiopia
-
 Finland
-
 France
-
 Georgia
-
 Germany
-
 Ghana
Ghana
-
 Greece
-
 Haiti
Haiti
-
 Hong Kong
-
 Hungary
-
 India
India
-
 Indonesia
-
 Iran, Islamic republic
-
 Iraq
Iraq
-
 Ireland
-
 Israel
-
 Italy
Italy
-
 Jamaica
-
 Japan
Japan
-
 Jordan
-
 Kazakhstan
-
 Kenya
Kenya
-
 Korea
Korea
-
 Kuwait
-
 Kyrgyzstan
-
 Laos
Laos
-
 Latvia
-
 Lebanon
-
 Lesotho
-
 Libya
Libya
-
 Lithuania
-
 Luxembourg
-
 Madagascar
-
 Malaysia
-
 Malta
Malta
-
 Mauritius
-
 Mexico
-
 Moldova
-
 Mongolia
-
 Montenegro
-
 Morocco
-
 Mozambique
-
 Myanmar
-
 Namibia
-
 Nepal
Nepal
-
 Netherlands
-
 New Zealand
-
 Nigeria
-
 North Macedonia
-
 Norway
-
 Oman
Oman
-
 Pakistan
-
 Palestine
-
 Panama
-
 Papua New Guinea
-
 Paraguay
-
 Peru
Peru
-
 Philippines
-
 Poland
-
 Portugal
-
 Puerto Rico
-
 Qatar
Qatar
-
 Reunion
-
 Romania
-
 Rwanda
-
 Saudi Arabia
-
 Serbia
-
 Singapore
-
 Slovakia
-
 Slovenia
-
 Somalia
-
 South Africa
-
 Spain
Spain
-
 Sri Lanka
-
 Sweden
-
 Switzerland
-
 Syria
Syria
-
 Taiwan
-
 Tajikistan
-
 Tanzania
-
 Thailand
-
 Trinidad and Tobago
-
 Tunisia
-
 Turkey
-
 UAE
UAE
-
 Uganda
-
 Ukraine
-
 United Kingdom
-
United States
-
 Uruguay
-
 Uzbekistan
-
 Venezuela
-
 Vietnam
-
 Yemen
Yemen
-
 Zambia
-
 Zimbabwe
- Forex
- Crypto
