
Antitrust scrutiny and bearish signals — Microsoft stock pressured near lows

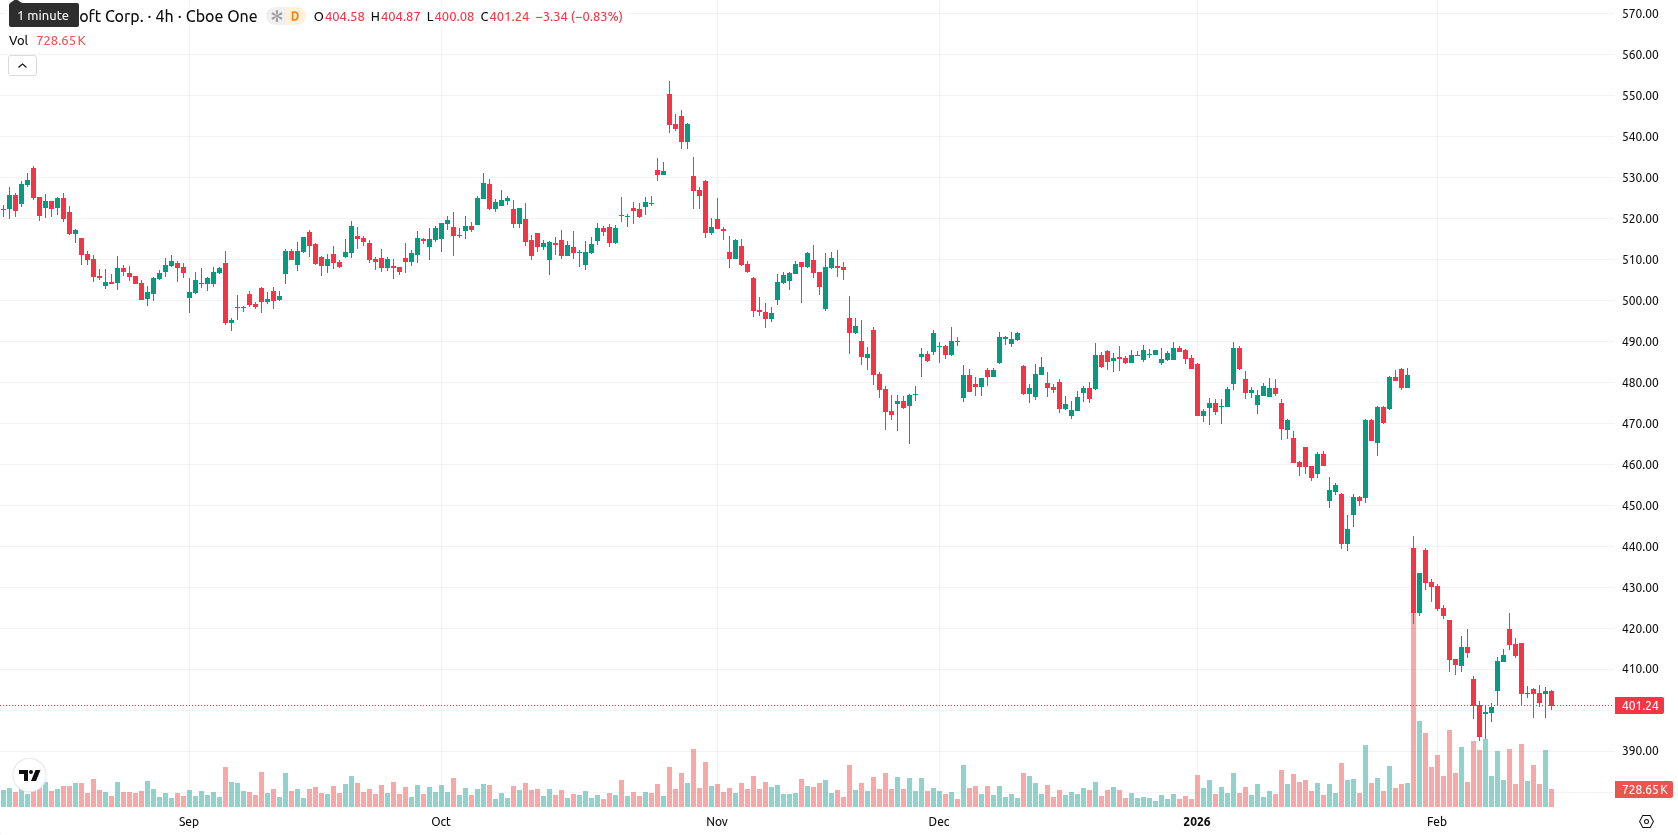
Microsoft Corporation (MSFT) is trading at $401.12, positioned well below the MA-20 ($432.51), MA-50 ($460.93), and MA-200 ($487.37), indicating that short-, medium-, and long-term trends remain under pressure from sellers. Sellers have kept Microsoft under sustained pressure, as shown by today's loss of $0.72 (0.18%), and the price remains close to its intraday low.
Highlights
- US regulators have expanded an antitrust investigation into Microsoft’s bundling of AI, cloud, and security products, raising competitive concerns in the industry.
- AM Investment Strategies LLC cut its Microsoft shareholding by 6.8% in Q3, per recent SEC filings, signaling institutional reservations.
- Microsoft stock trades at $401.12, well below key moving averages, with bearish momentum indicators and a high probability (>80%) of further downside within a $393.00–$408.00 consolidation range.
Regulatory scrutiny intensifies amid antitrust probe and portfolio reduction
US regulators have expanded an antitrust investigation into Microsoft’s cloud and AI business practices, with the Federal Trade Commission recently sending new information requests to rival firms. This regulatory scrutiny focuses on Microsoft’s bundling of AI, cloud, and security products, examining whether such practices limit competition. Microsoft has also signaled a strategic realignment in AI partnerships, adjusting its arrangement with OpenAI to reduce operational risk. Additionally, AM Investment Strategies LLC reported a 6.8% reduction in its Microsoft shareholding during the third quarter, as disclosed in SEC filings.
Bearish momentum confirmed as key indicators and resistance converge
Technical indicators confirm a bearish outlook for Microsoft, with the stock trading well below key moving averages. The nearest dynamic resistance is the Ichimoku Kijun at $438.03, while no immediate support from moving averages is evident. Daily momentum studies reinforce the negative bias: MACD and ADX continue to show downside strength, the RSI is deeply oversold at 32.30, Bull/Bear Power stands at –12.11 (oversold), and the CCI remains in a 'sell' position at –86.33. The Stochastic RSI is neutral but close to oversold, and the Awesome Oscillator does not contradict the prevailing momentum; sellers dictate the tone as the price sits near the lower boundary of today's $398.25 – $405.38 range.
Consolidation risk dominates as breakdown probability rises
For the next five trading days, Microsoft is expected to fluctuate within a volatility band of $393.00 to $408.00. The likelihood of a further price decrease is very high (above 80%), with the probability of a significant rebound remaining low. The baseline scenario suggests consolidation between $393.00 and $408.00, while a decisive drop below $393.00 could trigger additional declines. Any bullish reversal would require a sustained breakout above $408.00 and the Ichimoku Kijun, but current momentum indicators do not support this scenario.
Last time, analysts noted that Microsoft is trading well below key moving averages and major resistance levels, with momentum and trend indicators, including the MACD and ADX, confirming persistent bearish pressure despite oversold RSI and oscillators. Downside risk remains elevated due to the lack of nearby technical support, with limited potential for a rebound unless the price breaks above critical resistance around the Ichimoku Kijun level.


Latest Microsoft News


-
 Afghanistan
-
 Albania
-
 Algeria
-
 Angola
-
 Argentina
-
 Armenia
-
 Australia
-
 Austria
-
 Azerbaijan
-
 Bahamas
-
 Bahrain
-
 Bangladesh
-
 Belarus
-
 Belgium
-
 Bolivia
-
 Botswana
-
 Brazil
-
 Brunei
-
 Bulgaria
-
 Cambodia
-
 Cameroon
-
 Canada
-
 Chile
Chile
-
 China
China
-
 Colombia
-
 Congo
Congo
-
 Costa Rica
-
 Cote d'Ivoire
-
 Croatia
-
 Cuba
Cuba
-
 Cyprus
-
 Czechia
-
 DR Congo
-
 Denmark
-
 Dominican Republic
-
 Ecuador
-
 Egypt
Egypt
-
 El Salvador
-
 Estonia
-
 Eswatini
-
 Ethiopia
-
 Finland
-
 France
-
 Georgia
-
 Germany
-
 Ghana
Ghana
-
 Greece
-
 Haiti
Haiti
-
 Hong Kong
-
 Hungary
-
 India
India
-
 Indonesia
-
 Iran, Islamic republic
-
 Iraq
Iraq
-
 Ireland
-
 Israel
-
 Italy
Italy
-
 Jamaica
-
 Japan
Japan
-
 Jordan
-
 Kazakhstan
-
 Kenya
Kenya
-
 Korea
Korea
-
 Kuwait
-
 Kyrgyzstan
-
 Laos
Laos
-
 Latvia
-
 Lebanon
-
 Lesotho
-
 Libya
Libya
-
 Lithuania
-
 Luxembourg
-
 Madagascar
-
 Malaysia
-
 Malta
Malta
-
 Mauritius
-
 Mexico
-
 Moldova
-
 Mongolia
-
 Montenegro
-
 Morocco
-
 Mozambique
-
 Myanmar
-
 Namibia
-
 Nepal
Nepal
-
 Netherlands
-
 New Zealand
-
 Nigeria
-
 North Macedonia
-
 Norway
-
 Oman
Oman
-
 Pakistan
-
 Palestine
-
 Panama
-
 Papua New Guinea
-
 Paraguay
-
 Peru
Peru
-
 Philippines
-
 Poland
-
 Portugal
-
 Puerto Rico
-
 Qatar
Qatar
-
 Reunion
-
 Romania
-
 Rwanda
-
 Saudi Arabia
-
 Serbia
-
 Singapore
-
 Slovakia
-
 Slovenia
-
 Somalia
-
 South Africa
-
 Spain
Spain
-
 Sri Lanka
-
 Sweden
-
 Switzerland
-
 Syria
Syria
-
 Taiwan
-
 Tajikistan
-
 Tanzania
-
 Thailand
-
 Trinidad and Tobago
-
 Tunisia
-
 Turkey
-
 UAE
UAE
-
 Uganda
-
 Ukraine
-
 United Kingdom
-
United States
-
 Uruguay
-
 Uzbekistan
-
 Venezuela
-
 Vietnam
-
 Yemen
Yemen
-
 Zambia
-
 Zimbabwe
- Forex
- Crypto
