
Microsoft stock declines as regulatory scrutiny and weak technicals pressure the market

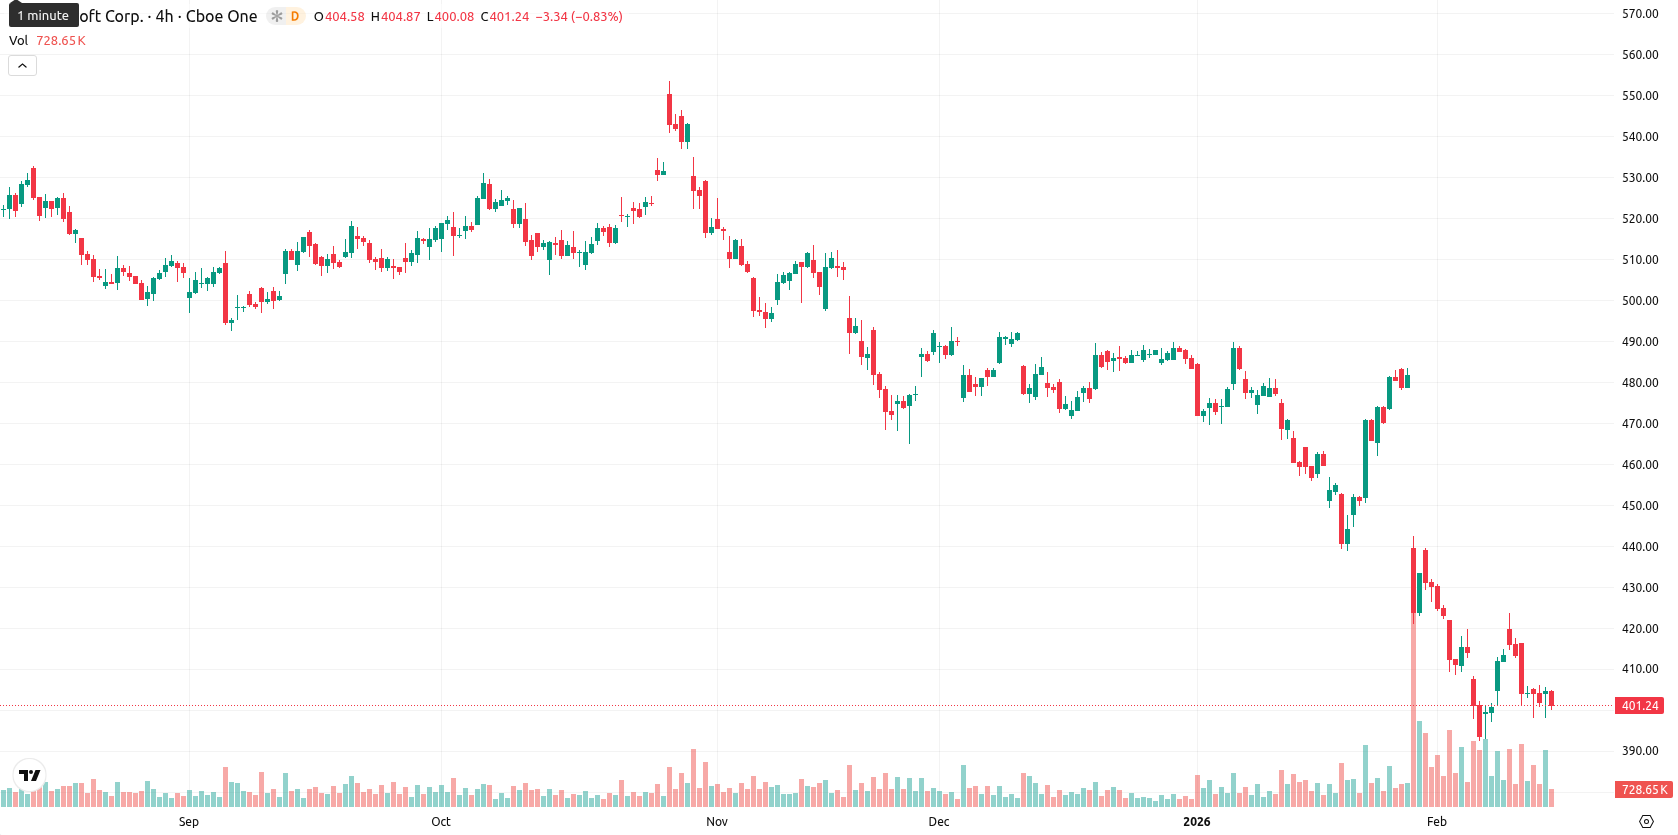
Microsoft Corporation (MSFT) is trading at $401.12, marking a mild daily decline of 0.18% as prices remain well below the MA-20 ($432.51), MA-50 ($460.93), and MA-200 ($487.37). This positioning highlights persistent downside pressure in the share price across short- and long-term timeframes.
Highlights
- The US Federal Trade Commission has opened a major antitrust investigation into Microsoft's cloud and AI businesses, targeting cloud licensing and AI service bundling practices.
- Regulatory scrutiny introduces elevated risks of litigation, operational changes, or penalties that could disrupt Microsoft's market position and increase compliance costs.
- Microsoft shares trade at $401.12, below MA-20 ($432.51) and MA-200 ($487.37), with strong downside momentum and short-term support in the $390.00–$408.00 range.
Regulatory risk escalates as antitrust probe targets cloud and AI
The US Federal Trade Commission has launched a significant antitrust investigation into Microsoft's cloud computing and artificial intelligence business practices. The inquiry centers on the company's cloud licensing and AI service bundling, raising regulatory risks around potential litigation, operational changes, or penalties that could disrupt its market position. Heightened scrutiny may weigh on Microsoft's ability to maintain market structure and introduce additional compliance costs.
Bearish control confirmed as momentum indicators align at lows
Technical momentum remains decisively bearish for MSFT, with persistent negative signals from MACD and ADX confirming seller control. The price is well below key moving averages, while the Ichimoku Kijun level at $438.03 stands as the nearest dynamic resistance with no major support from nearby averages. Oversold readings on RSI (32.30), CCI (–86.33), and Bull/Bear Power (–12.11) reinforce the dominant bearish trend, as Stochastic RSI stays in neutral-to-oversold territory and the Awesome Oscillator holds neutral. Intraday, Microsoft is trading near the lower end of today's range ($398.25 – $405.38) with no significant divergences among applied momentum indicators.
Further decline likely as volatility and bearish trend persist
MSFT is expected to trade within a typical volatility band of $390.00 – $408.00 over the next week, given its current level of $401.12 and ongoing downside momentum. The probability of a sustained price increase is low, with further decline more likely based on daily and weekly technical indicators. Baseline expectations call for sideways consolidation between $390 and $408, with a close above $438 needed to signal a bullish recovery. If MSFT closes below $390, deeper retracement toward $380 could develop.
Previously it was reported that Microsoft is trading significantly below its short-, medium-, and long-term moving averages, with technical indicators such as MACD, ADX, and RSI confirming persistent bearish momentum and a lack of nearby support. Sellers continue to dominate as the price remains close to recent lows, and a further breakdown is likely unless the stock can decisively reclaim resistance near the Ichimoku Kijun level.


Latest Microsoft News


-
 Afghanistan
-
 Albania
-
 Algeria
-
 Angola
-
 Argentina
-
 Armenia
-
 Australia
-
 Austria
-
 Azerbaijan
-
 Bahamas
-
 Bahrain
-
 Bangladesh
-
 Belarus
-
 Belgium
-
 Bolivia
-
 Botswana
-
 Brazil
-
 Brunei
-
 Bulgaria
-
 Cambodia
-
 Cameroon
-
 Canada
-
 Chile
Chile
-
 China
China
-
 Colombia
-
 Congo
Congo
-
 Costa Rica
-
 Cote d'Ivoire
-
 Croatia
-
 Cuba
Cuba
-
 Cyprus
-
 Czechia
-
 DR Congo
-
 Denmark
-
 Dominican Republic
-
 Ecuador
-
 Egypt
Egypt
-
 El Salvador
-
 Estonia
-
 Eswatini
-
 Ethiopia
-
 Finland
-
 France
-
 Georgia
-
 Germany
-
 Ghana
Ghana
-
 Greece
-
 Haiti
Haiti
-
 Hong Kong
-
 Hungary
-
 India
India
-
 Indonesia
-
 Iran, Islamic republic
-
 Iraq
Iraq
-
 Ireland
-
 Israel
-
 Italy
Italy
-
 Jamaica
-
 Japan
Japan
-
 Jordan
-
 Kazakhstan
-
 Kenya
Kenya
-
 Korea
Korea
-
 Kuwait
-
 Kyrgyzstan
-
 Laos
Laos
-
 Latvia
-
 Lebanon
-
 Lesotho
-
 Libya
Libya
-
 Lithuania
-
 Luxembourg
-
 Madagascar
-
 Malaysia
-
 Malta
Malta
-
 Mauritius
-
 Mexico
-
 Moldova
-
 Mongolia
-
 Montenegro
-
 Morocco
-
 Mozambique
-
 Myanmar
-
 Namibia
-
 Nepal
Nepal
-
 Netherlands
-
 New Zealand
-
 Nigeria
-
 North Macedonia
-
 Norway
-
 Oman
Oman
-
 Pakistan
-
 Palestine
-
 Panama
-
 Papua New Guinea
-
 Paraguay
-
 Peru
Peru
-
 Philippines
-
 Poland
-
 Portugal
-
 Puerto Rico
-
 Qatar
Qatar
-
 Reunion
-
 Romania
-
 Rwanda
-
 Saudi Arabia
-
 Serbia
-
 Singapore
-
 Slovakia
-
 Slovenia
-
 Somalia
-
 South Africa
-
 Spain
Spain
-
 Sri Lanka
-
 Sweden
-
 Switzerland
-
 Syria
Syria
-
 Taiwan
-
 Tajikistan
-
 Tanzania
-
 Thailand
-
 Trinidad and Tobago
-
 Tunisia
-
 Turkey
-
 UAE
UAE
-
 Uganda
-
 Ukraine
-
 United Kingdom
-
United States
-
 Uruguay
-
 Uzbekistan
-
 Venezuela
-
 Vietnam
-
 Yemen
Yemen
-
 Zambia
-
 Zimbabwe
- Forex
- Crypto
