
-1.10% for Alphabet stock — volatility persists amid pressure from technical indicators

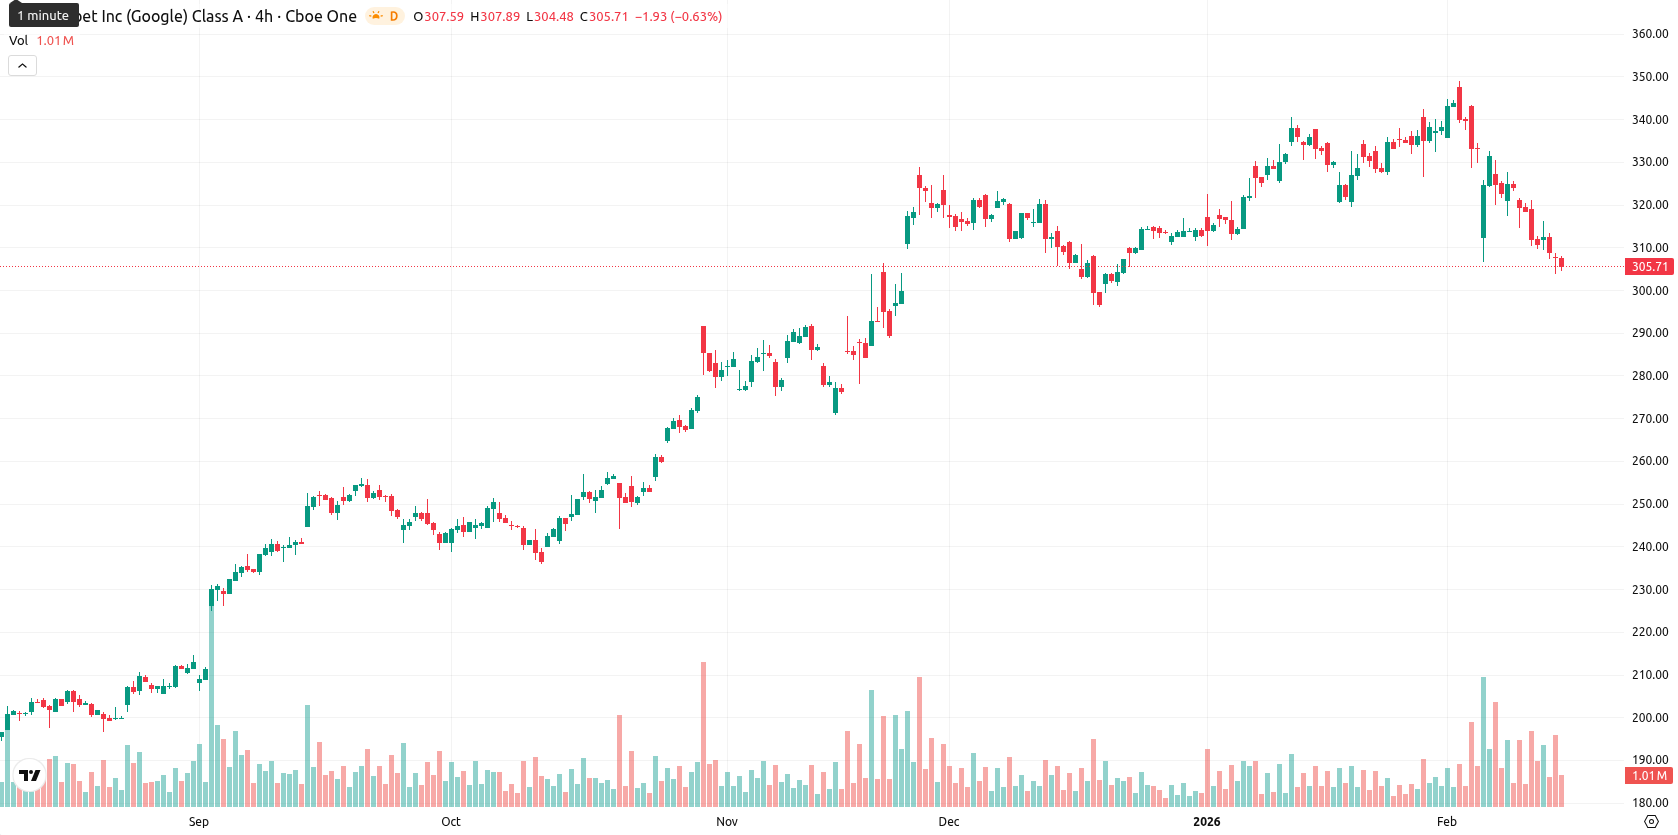
Alphabet Inc. (GOOGL) is trading at $305.60, well below its MA-20 ($327.93) and MA-50 ($321.23), but remains significantly above the MA-200 ($242.85), signaling ongoing downward short- and medium-term pressure even as the longer-term trend finds support.
Highlights
- Alphabet completed a $32 billion multicurrency bond sale and secured unconditional EU approval for its $32 billion Wiz acquisition, advancing AI infrastructure and cybersecurity expansion.
- The company announced a $10 billion Kansas City data center campus as part of its AI and cloud strategy, and reported quarterly revenue of $113.83 billion, exceeding expectations.
- GOOGL closed at $305.60, below MA-20 ($327.93) and MA-50 ($321.23) with oversold momentum; key support sits near $295.82, with further downside likely short term.
Capital raise and EU approval drive optimism amid expansion push
Alphabet recently completed a $32 billion multicurrency bond sale, including a 100-year bond, to fund AI infrastructure expansion and received unconditional EU antitrust approval for its $32 billion acquisition of cybersecurity firm Wiz. The company also announced plans for a $10 billion data center campus in Kansas City as part of its AI and cloud strategy. In its latest quarter, Alphabet reported revenue of $113.83 billion, exceeding expectations, and declared a quarterly dividend of $0.21 per share to be paid on March 16, 2026.
Weak technicals as oscillators flag oversold risk and resistance
Technical momentum for GOOGL remains weak, with the MACD on the daily chart classified as Neutral and the ADX signaling a Sell, indicating the absence of a strong directional trend and only modest momentum. Oscillators are firmly in oversold territory — the RSI is at 31.90, CCI stands at -181.75, and Stochastic RSI sits at 0.00 — signaling risks of short-term exhaustion but not yet reversal. Bull/Bear Power confirms dominant selling (Oversold, -12.99) and the Awesome Oscillator supports a bearish bias. The nearest dynamic resistance is the Ichimoku Kijun at $326.44, while primary support aligns with the MA-100 at $295.82.
Stabilization likely as bearish risk persists in narrow band
Over the next five days, GOOGL is likely to trade within a volatility band of $299.00 to $310.00 relative to current levels. The probability of a rebound is low, with only one of four key weekly indicators supporting upside, so further price decrease remains the dominant scenario. Baseline expectations call for stabilization within a sideways corridor. If sentiment unexpectedly shifts, a recovery above $326.44 would be the first bullish signal, while a break below $299.00 would confirm continued seller control and extended weakness.
Previously it was reported that Alphabet Inc. remains under short- and medium-term bearish pressure with the price trading below its 20- and 50-day moving averages and most daily indicators, including RSI and MACD, signaling oversold conditions. Key resistance is identified near $326, with possible further downside toward long-term support around the 200-day moving average if the $300 level fails to hold.


Latest Google News


-
 Afghanistan
-
 Albania
-
 Algeria
-
 Angola
-
 Argentina
-
 Armenia
-
 Australia
-
 Austria
-
 Azerbaijan
-
 Bahamas
-
 Bahrain
-
 Bangladesh
-
 Belarus
-
 Belgium
-
 Bolivia
-
 Botswana
-
 Brazil
-
 Brunei
-
 Bulgaria
-
 Cambodia
-
 Cameroon
-
 Canada
-
 Chile
Chile
-
 China
China
-
 Colombia
-
 Congo
Congo
-
 Costa Rica
-
 Cote d'Ivoire
-
 Croatia
-
 Cuba
Cuba
-
 Cyprus
-
 Czechia
-
 DR Congo
-
 Denmark
-
 Dominican Republic
-
 Ecuador
-
 Egypt
Egypt
-
 El Salvador
-
 Estonia
-
 Eswatini
-
 Ethiopia
-
 Finland
-
 France
-
 Georgia
-
 Germany
-
 Ghana
Ghana
-
 Greece
-
 Haiti
Haiti
-
 Hong Kong
-
 Hungary
-
 India
India
-
 Indonesia
-
 Iran, Islamic republic
-
 Iraq
Iraq
-
 Ireland
-
 Israel
-
 Italy
Italy
-
 Jamaica
-
 Japan
Japan
-
 Jordan
-
 Kazakhstan
-
 Kenya
Kenya
-
 Korea
Korea
-
 Kuwait
-
 Kyrgyzstan
-
 Laos
Laos
-
 Latvia
-
 Lebanon
-
 Lesotho
-
 Libya
Libya
-
 Lithuania
-
 Luxembourg
-
 Madagascar
-
 Malaysia
-
 Malta
Malta
-
 Mauritius
-
 Mexico
-
 Moldova
-
 Mongolia
-
 Montenegro
-
 Morocco
-
 Mozambique
-
 Myanmar
-
 Namibia
-
 Nepal
Nepal
-
 Netherlands
-
 New Zealand
-
 Nigeria
-
 North Macedonia
-
 Norway
-
 Oman
Oman
-
 Pakistan
-
 Palestine
-
 Panama
-
 Papua New Guinea
-
 Paraguay
-
 Peru
Peru
-
 Philippines
-
 Poland
-
 Portugal
-
 Puerto Rico
-
 Qatar
Qatar
-
 Reunion
-
 Romania
-
 Rwanda
-
 Saudi Arabia
-
 Serbia
-
 Singapore
-
 Slovakia
-
 Slovenia
-
 Somalia
-
 South Africa
-
 Spain
Spain
-
 Sri Lanka
-
 Sweden
-
 Switzerland
-
 Syria
Syria
-
 Taiwan
-
 Tajikistan
-
 Tanzania
-
 Thailand
-
 Trinidad and Tobago
-
 Tunisia
-
 Turkey
-
 UAE
UAE
-
 Uganda
-
 Ukraine
-
 United Kingdom
-
United States
-
 Uruguay
-
 Uzbekistan
-
 Venezuela
-
 Vietnam
-
 Yemen
Yemen
-
 Zambia
-
 Zimbabwe
- Forex
- Crypto
