
-3.31% for AMD stock — downside gap and trend pressure drive losses

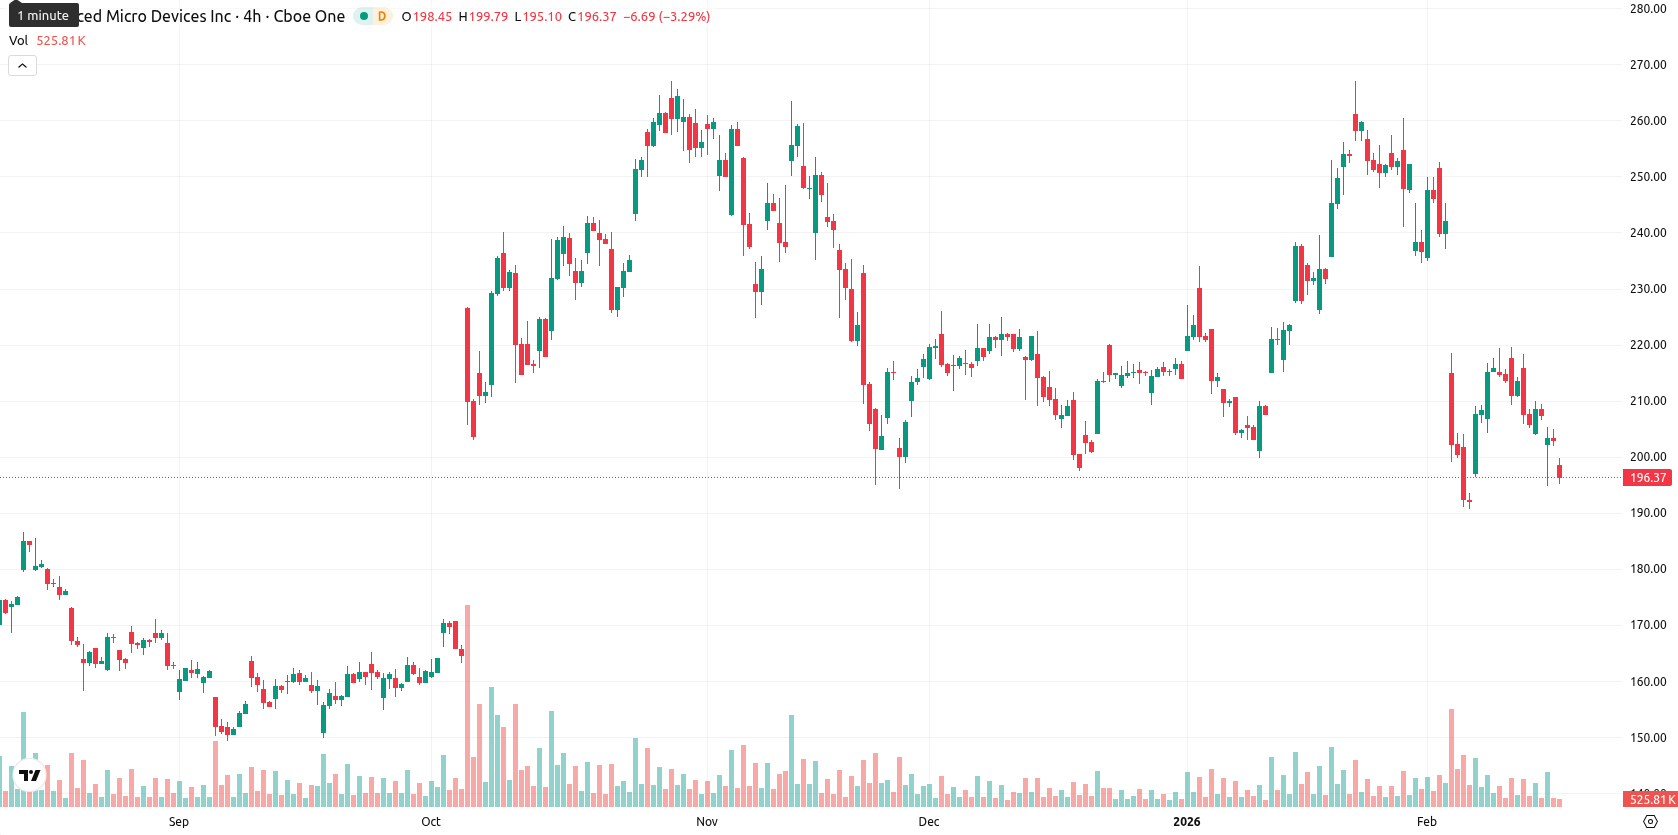
Advanced Micro Devices, Inc. (AMD) is trading at $196.35, well below its MA-20 at $229.44 and MA-50 at $220.85, signaling strong short- and medium-term pressure from sellers. The price remains above the MA-200 ($182.47), indicating a longer-term support, while the nearest dynamic resistance is set by Ichimoku Kijun at $228.81.
Highlights
- AMD trades at $196.35, sharply below its MA-20 ($229.44) and MA-50 ($220.85), indicating persistent short- and medium-term selling pressure.
- Momentum indicators such as MACD, ADX, RSI, and Stochastic RSI all point to a strong bearish trend, with oversold conditions and dominant seller activity.
- Immediate support is at $192, with further downside to $188 if broken; resistance is at $204 and then $210, with the next 5-day range expected between $192 and $204.
Momentum weakness and volatility as multiple indicators show oversold trend
Momentum indicators give a strong bearish signal, with the MACD showing sell and the ADX at low strength, pointing to a weak trend. The RSI and Stochastic RSI both indicate oversold conditions, while the Commodity Channel Index also flags selling pressure; Bull/Bear Power confirms dominance of sellers with a sharply negative reading. The previous close at $203.08 and today’s open at $198.44 show a clear downside gap. The current price sits at the lower end of today’s range ($197.11 – $199.75), reflecting high intraday volatility and continued pressure after the open.
Bearish bias maintained amid narrow volatility band and weak buy signals
Looking ahead, the typical 5-day volatility band is expected between $192 and $204, keeping the price around current levels due to recent volatility. Based on weekly signals — one buy (ADX), one strong buy (MACD), and two sell signals (RSI, MA-50) — the probability of an increase in the next 5 days is very low (less than 20%), making a further decline more likely. The baseline scenario is continued sideways movement within this corridor. A bullish scenario would require the price to reclaim $204 and challenge $210, while a bearish scenario unfolds if support at $192 breaks, exposing $188 as the next downside target.
Previously it was reported that Advanced Micro Devices Inc is trading below its short- and medium-term moving averages, reflecting persistent selling pressure and pronounced bearish momentum as indicated by daily MACD, ADX, and oscillators signaling oversold conditions. Institutional buying remains present despite the stock hovering above its long-term support with key resistance near $228, while ongoing volatility and intraday activity suggest sellers continue to dominate in the near term.


Latest AMD News


-
 Afghanistan
-
 Albania
-
 Algeria
-
 Angola
-
 Argentina
-
 Armenia
-
 Australia
-
 Austria
-
 Azerbaijan
-
 Bahamas
-
 Bahrain
-
 Bangladesh
-
 Belarus
-
 Belgium
-
 Bolivia
-
 Botswana
-
 Brazil
-
 Brunei
-
 Bulgaria
-
 Cambodia
-
 Cameroon
-
 Canada
-
 Chile
Chile
-
 China
China
-
 Colombia
-
 Congo
Congo
-
 Costa Rica
-
 Cote d'Ivoire
-
 Croatia
-
 Cuba
Cuba
-
 Cyprus
-
 Czechia
-
 DR Congo
-
 Denmark
-
 Dominican Republic
-
 Ecuador
-
 Egypt
Egypt
-
 El Salvador
-
 Estonia
-
 Eswatini
-
 Ethiopia
-
 Finland
-
 France
-
 Georgia
-
 Germany
-
 Ghana
Ghana
-
 Greece
-
 Haiti
Haiti
-
 Hong Kong
-
 Hungary
-
 India
India
-
 Indonesia
-
 Iran, Islamic republic
-
 Iraq
Iraq
-
 Ireland
-
 Israel
-
 Italy
Italy
-
 Jamaica
-
 Japan
Japan
-
 Jordan
-
 Kazakhstan
-
 Kenya
Kenya
-
 Korea
Korea
-
 Kuwait
-
 Kyrgyzstan
-
 Laos
Laos
-
 Latvia
-
 Lebanon
-
 Lesotho
-
 Libya
Libya
-
 Lithuania
-
 Luxembourg
-
 Madagascar
-
 Malaysia
-
 Malta
Malta
-
 Mauritius
-
 Mexico
-
 Moldova
-
 Mongolia
-
 Montenegro
-
 Morocco
-
 Mozambique
-
 Myanmar
-
 Namibia
-
 Nepal
Nepal
-
 Netherlands
-
 New Zealand
-
 Nigeria
-
 North Macedonia
-
 Norway
-
 Oman
Oman
-
 Pakistan
-
 Palestine
-
 Panama
-
 Papua New Guinea
-
 Paraguay
-
 Peru
Peru
-
 Philippines
-
 Poland
-
 Portugal
-
 Puerto Rico
-
 Qatar
Qatar
-
 Reunion
-
 Romania
-
 Rwanda
-
 Saudi Arabia
-
 Serbia
-
 Singapore
-
 Slovakia
-
 Slovenia
-
 Somalia
-
 South Africa
-
 Spain
Spain
-
 Sri Lanka
-
 Sweden
-
 Switzerland
-
 Syria
Syria
-
 Taiwan
-
 Tajikistan
-
 Tanzania
-
 Thailand
-
 Trinidad and Tobago
-
 Tunisia
-
 Turkey
-
 UAE
UAE
-
 Uganda
-
 Ukraine
-
 United Kingdom
-
United States
-
 Uruguay
-
 Uzbekistan
-
 Venezuela
-
 Vietnam
-
 Yemen
Yemen
-
 Zambia
-
 Zimbabwe
- Forex
- Crypto
