
Quantum Computing stock: Policy optimism and big deal drive a 4.38% rise despite mixed technicals

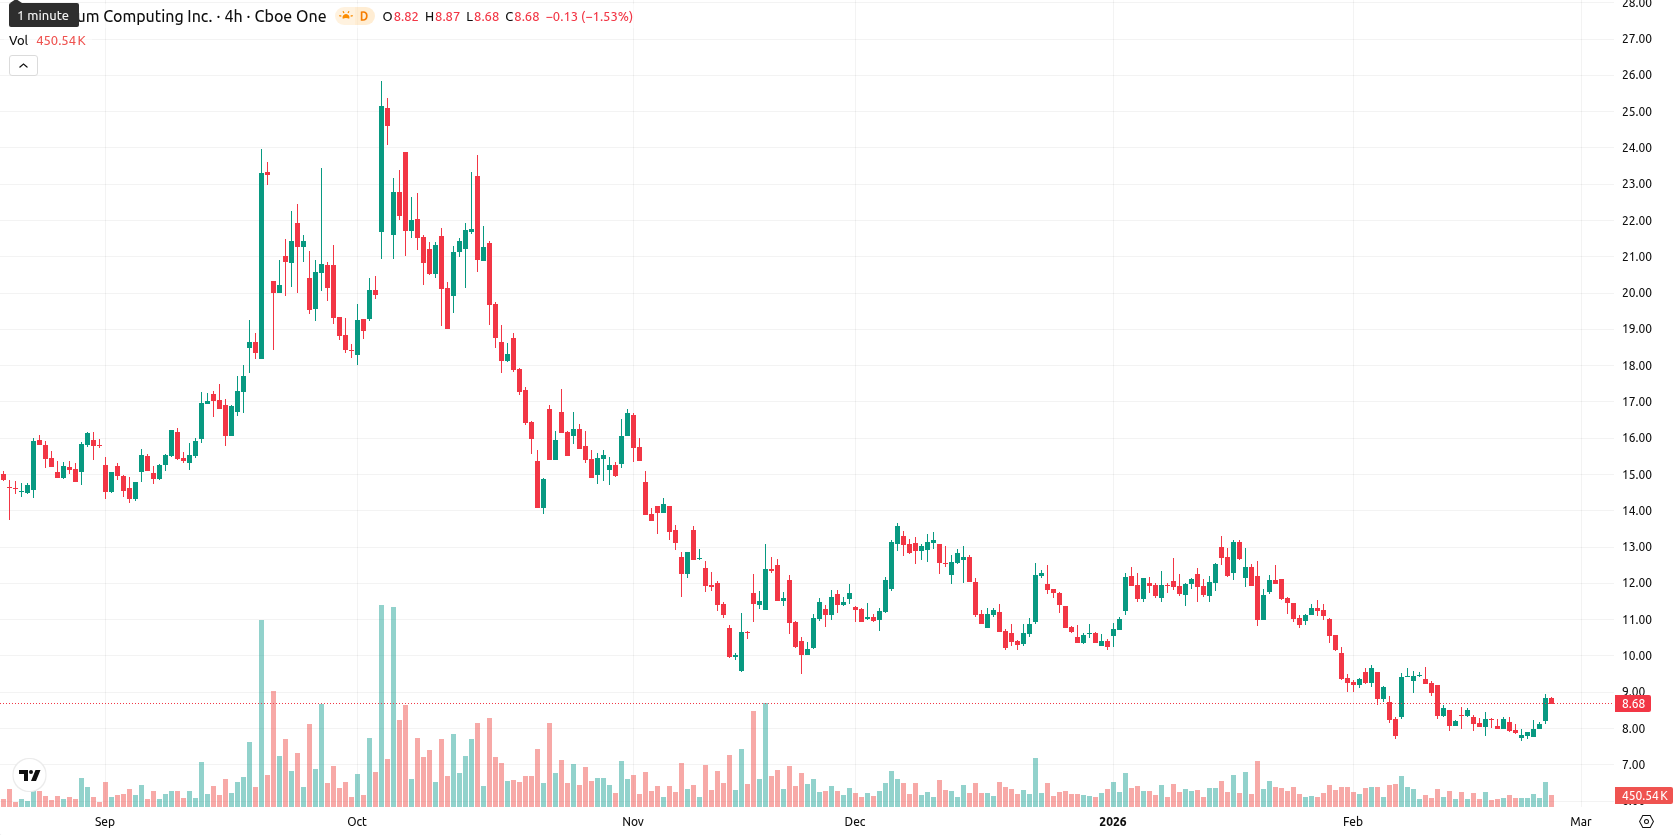
Quantum Computing Inc. (QUBT) is trading at $9.06, up 4.38% ($0.38) for the day. The share price currently sits just above the MA-20 ($8.83), but remains below the MA-50 ($10.41) and MA-200 ($14.41), indicating short-term momentum is strengthening while the medium- and long-term trends remain under seller pressure.
Highlights
- Quantum Computing attracts increased investor interest after a major $110 million cash acquisition, positioning QUBT for accelerated growth.
- Expectations for expanded U.S. government support via an executive order create a favorable policy backdrop for quantum technology adoption.
- QUBT trades at $9.06, just above MA-20 ($8.83) but below key resistances at MA-50 ($10.41) and immediate technical resistance near $10.30.
Investor sentiment shifts amid acquisition and government policy catalysts
Quantum Computing is attracting increased investor interest following the announcement of a major $110 million cash acquisition. Optimism is further supported by expectations for expanded U.S. government backing of quantum technology through an upcoming executive order. These developments position QUBT to capitalize on shifting policy and favorable industry dynamics.
Resistance at Kijun and mixed oscillator signals as momentum builds
Technically, QUBT is encountering immediate resistance at the Ichimoku Kijun ($10.29) and remains capped beneath the MA-50 and MA-200, underscoring prevailing medium- and long-term selling pressure. Among oscillators, the daily MACD gives a strong sell, ADX is low (signaling a weak trend), and RSI sits at 44.40 (leaning bearish). The Stochastic RSI indicates overbought conditions, while CCI reads as neutral. Bull/Bear Power is moderately positive, pointing to intraday buyer dominance, though the Awesome Oscillator is neutral and does not confirm the session’s upward move. The price gapped down at the open but now hovers near its intraday high after moderate volatility, with strengthening short-term momentum contrasting with mixed oscillator signals.
Probable sideways action seen as breakout odds remain limited
For the coming week, the anticipated price range is $8.15 to $9.95, reflecting typical volatility relative to current levels. Based on weekly indicators, the probability of a sustained upward break is below 20%, suggesting a higher likelihood of further decline or sideways movement. The base case remains a sideways trend within this volatility band; a bullish move will require a decisive close above $10.30 resistance, while a breakdown below $8.15 would confirm a bearish scenario.
Previously it was reported that Quantum Computing Inc. is trading below key moving averages with persistent downward pressure, while technical indicators such as MACD and ADX suggest continued weakness and a lack of strong trend momentum. Despite short-term oversold signals in RSI and CCI and some support from Stoch RSI, the stock faces dynamic resistance near $10.41 and lacks meaningful support above its current level, indicating limited near-term upside unless it breaks above immediate resistance.


Latest Quantum Computing News


-
 Afghanistan
-
 Albania
-
 Algeria
-
 Angola
-
 Argentina
-
 Armenia
-
 Australia
-
 Austria
-
 Azerbaijan
-
 Bahamas
-
 Bahrain
-
 Bangladesh
-
 Belarus
-
 Belgium
-
 Bolivia
-
 Botswana
-
 Brazil
-
 Brunei
-
 Bulgaria
-
 Cambodia
-
 Cameroon
-
 Canada
-
 Chile
Chile
-
 China
China
-
 Colombia
-
 Congo
Congo
-
 Costa Rica
-
 Cote d'Ivoire
-
 Croatia
-
 Cuba
Cuba
-
 Cyprus
-
 Czechia
-
 DR Congo
-
 Denmark
-
 Dominican Republic
-
 Ecuador
-
 Egypt
Egypt
-
 El Salvador
-
 Estonia
-
 Eswatini
-
 Ethiopia
-
 Finland
-
 France
-
 Georgia
-
 Germany
-
 Ghana
Ghana
-
 Greece
-
 Haiti
Haiti
-
 Hong Kong
-
 Hungary
-
 India
India
-
 Indonesia
-
 Iran, Islamic republic
-
 Iraq
Iraq
-
 Ireland
-
 Israel
-
 Italy
Italy
-
 Jamaica
-
 Japan
Japan
-
 Jordan
-
 Kazakhstan
-
 Kenya
Kenya
-
 Korea
Korea
-
 Kuwait
-
 Kyrgyzstan
-
 Laos
Laos
-
 Latvia
-
 Lebanon
-
 Lesotho
-
 Libya
Libya
-
 Lithuania
-
 Luxembourg
-
 Madagascar
-
 Malaysia
-
 Malta
Malta
-
 Mauritius
-
 Mexico
-
 Moldova
-
 Mongolia
-
 Montenegro
-
 Morocco
-
 Mozambique
-
 Myanmar
-
 Namibia
-
 Nepal
Nepal
-
 Netherlands
-
 New Zealand
-
 Nigeria
-
 North Macedonia
-
 Norway
-
 Oman
Oman
-
 Pakistan
-
 Palestine
-
 Panama
-
 Papua New Guinea
-
 Paraguay
-
 Peru
Peru
-
 Philippines
-
 Poland
-
 Portugal
-
 Puerto Rico
-
 Qatar
Qatar
-
 Reunion
-
 Romania
-
 Rwanda
-
 Saudi Arabia
-
 Serbia
-
 Singapore
-
 Slovakia
-
 Slovenia
-
 Somalia
-
 South Africa
-
 Spain
Spain
-
 Sri Lanka
-
 Sweden
-
 Switzerland
-
 Syria
Syria
-
 Taiwan
-
 Tajikistan
-
 Tanzania
-
 Thailand
-
 Trinidad and Tobago
-
 Tunisia
-
 Turkey
-
 UAE
UAE
-
 Uganda
-
 Ukraine
-
 United Kingdom
-
United States
-
 Uruguay
-
 Uzbekistan
-
 Venezuela
-
 Vietnam
-
 Yemen
Yemen
-
 Zambia
-
 Zimbabwe
- Forex
- Crypto
