
Meta rises 2.60% facing near-term resistance at the MA-50 level – weekly forecast

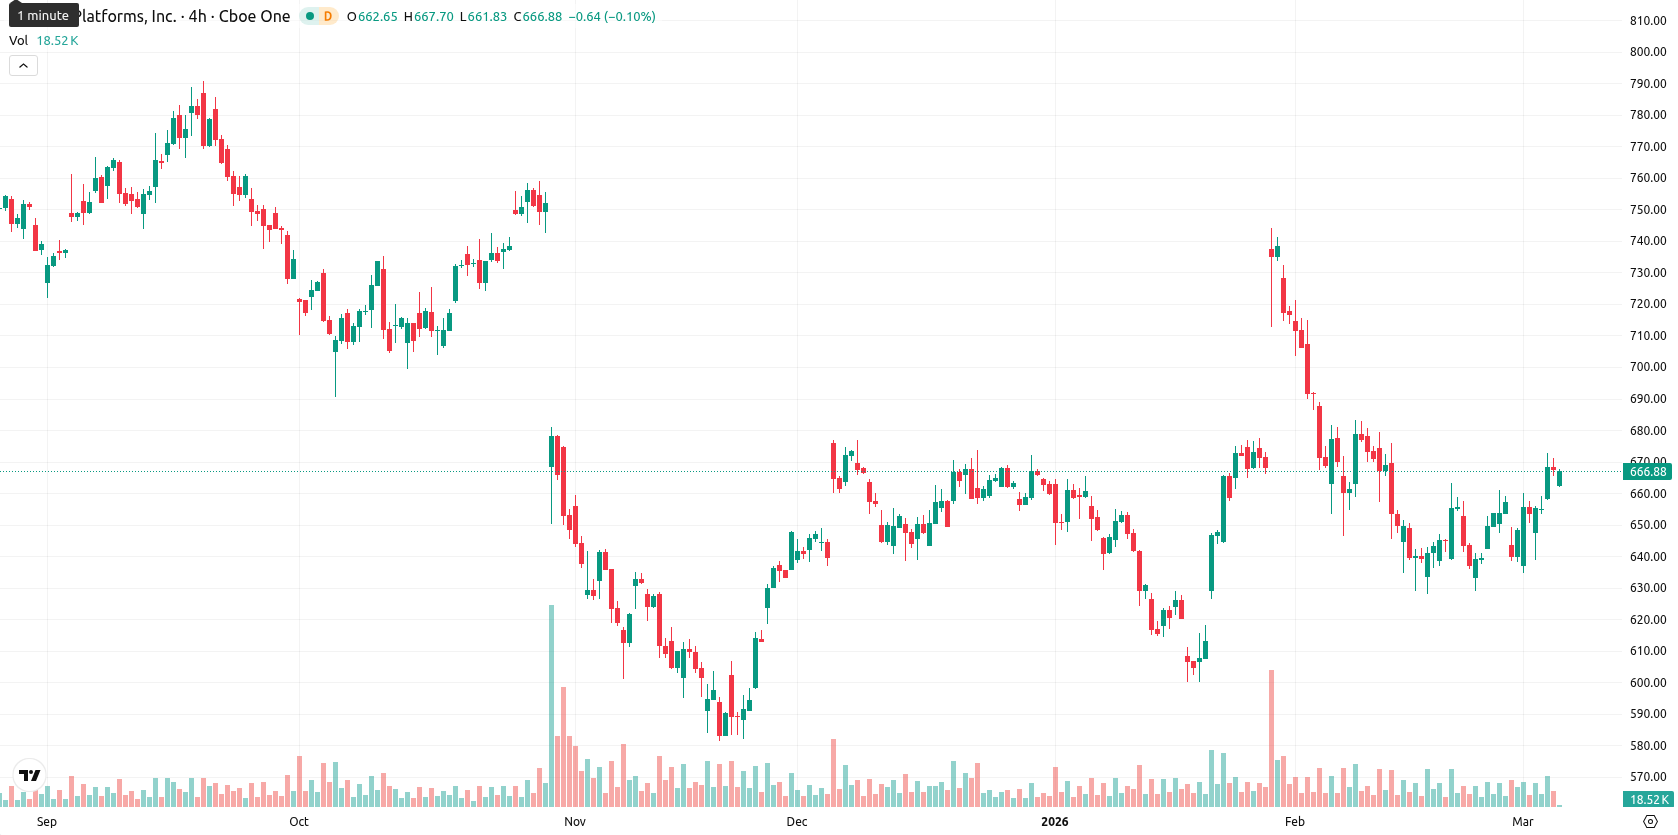
Meta Platforms, Inc. (META, formerly Facebook) is trading at $665.12, showing a weekly gain of $16.81 or 2.60%. The asset sits above its weekly MA-20 ($653.72) and the MA-200 ($432.45), yet remains just below the MA-50 ($669.28), highlighting continued bullish momentum in the medium and long term with nearby resistance at the MA-50.
Highlights
- META trades in a defined $632–$698 weekly range, with technicals showing a bullish medium-term trend but key resistance nearby.
- Bearish momentum indicators diverge from recent price gains, flagging a potential overextension and increased likelihood of a short-term pullback.
- A decisive break above $698 requires renewed buying strength, while a slip below $632 could accelerate downside on sustained selling pressure.
Robust Q4 results and AI partnerships drive improved sentiment this week
Meta reported strong Q4 2025 results with 24% year-over-year revenue growth, driven by rising AI-powered ad performance and infrastructure expansion. The company unveiled a major partnership with AMD to enhance its AI infrastructure and declared a quarterly dividend of $0.525 per share, payable on March 26 to shareholders of record as of March 16. Additional news included CFO Susan Li's share sale under a pre-arranged plan and Meta's consideration of re-entering the stablecoin payments market under new US regulation.
Technical momentum mixed with overbought signals and volatility rising
On the weekly chart, META remains above the MA-20 and MA-200 but is capped just below the MA-50, reflecting strong underlying support with near-term resistance. Weekly volatility is elevated at 5.99%, while the MACD signals ongoing bearish momentum despite the price rally. The RSI (50.25), Stochastic RSI, and CCI all indicate neutral to slightly bullish conditions, though the Bull/Bear Power suggests overbought territory and strong buyer presence, which contrasts with the MACD’s warning signal and suggests potential exhaustion.
Stabilization expected next week as bearish momentum tempers upside
For the next 5 to 7 trading days, the forecast range is $632 to $698, anchored by typical volatility and current momentum signals. Technicals point to a limited 25% probability of renewed upside, with a higher chance of retracement if bearish momentum persists. The base case scenario is stabilization between $632 and $698 without a decisive catalyst; an upward breakout above $698 would require a sharp reversal in momentum, while a drop below $632 could emerge in case of increased selling pressure and further deterioration in the weekly technical setup.
Previously it was reported that Meta Platforms, Inc. is trading above its short- and medium-term moving averages, underscoring near-term bullish momentum, but remains capped by longer-term resistance near the MA-200. Technical indicators are mixed, with buy signals from RSI and CCI offset by bearish MACD and overbought conditions on Stochastic RSI and BBP, suggesting the stock is likely to consolidate in a range with downside risks prevailing if immediate support is breached.


-
 Afghanistan
-
 Albania
-
 Algeria
-
 Angola
-
 Argentina
-
 Armenia
-
 Australia
-
 Austria
-
 Azerbaijan
-
 Bahamas
-
 Bahrain
-
 Bangladesh
-
 Belarus
-
 Belgium
-
 Bolivia
-
 Botswana
-
 Brazil
-
 Brunei
-
 Bulgaria
-
 Cambodia
-
 Cameroon
-
 Canada
-
 Chile
Chile
-
 China
China
-
 Colombia
-
 Congo
Congo
-
 Costa Rica
-
 Cote d'Ivoire
-
 Croatia
-
 Cuba
Cuba
-
 Cyprus
-
 Czechia
-
 DR Congo
-
 Denmark
-
 Dominican Republic
-
 Ecuador
-
 Egypt
Egypt
-
 El Salvador
-
 Estonia
-
 Eswatini
-
 Ethiopia
-
 Finland
-
 France
-
 Georgia
-
 Germany
-
 Ghana
Ghana
-
 Greece
-
 Haiti
Haiti
-
 Hong Kong
-
 Hungary
-
 India
India
-
 Indonesia
-
 Iran, Islamic republic
-
 Iraq
Iraq
-
 Ireland
-
 Israel
-
 Italy
Italy
-
 Jamaica
-
 Japan
Japan
-
 Jordan
-
 Kazakhstan
-
 Kenya
Kenya
-
 Korea
Korea
-
 Kuwait
-
 Kyrgyzstan
-
 Laos
Laos
-
 Latvia
-
 Lebanon
-
 Lesotho
-
 Libya
Libya
-
 Lithuania
-
 Luxembourg
-
 Madagascar
-
 Malaysia
-
 Malta
Malta
-
 Mauritius
-
 Mexico
-
 Moldova
-
 Mongolia
-
 Montenegro
-
 Morocco
-
 Mozambique
-
 Myanmar
-
 Namibia
-
 Nepal
Nepal
-
 Netherlands
-
 New Zealand
-
 Nigeria
-
 North Macedonia
-
 Norway
-
 Oman
Oman
-
 Pakistan
-
 Palestine
-
 Panama
-
 Papua New Guinea
-
 Paraguay
-
 Peru
Peru
-
 Philippines
-
 Poland
-
 Portugal
-
 Puerto Rico
-
 Qatar
Qatar
-
 Reunion
-
 Romania
-
 Rwanda
-
 Saudi Arabia
-
 Serbia
-
 Singapore
-
 Slovakia
-
 Slovenia
-
 Somalia
-
 South Africa
-
 Spain
Spain
-
 Sri Lanka
-
 Sweden
-
 Switzerland
-
 Syria
Syria
-
 Taiwan
-
 Tajikistan
-
 Tanzania
-
 Thailand
-
 Trinidad and Tobago
-
 Tunisia
-
 Turkey
-
 UAE
UAE
-
 Uganda
-
 Ukraine
-
 United Kingdom
-
United States
-
 Uruguay
-
 Uzbekistan
-
 Venezuela
-
 Vietnam
-
 Yemen
Yemen
-
 Zambia
-
 Zimbabwe
- Forex
- Crypto
