
Technical weakness and oversold signals — American Airlines stock drops 7.10%

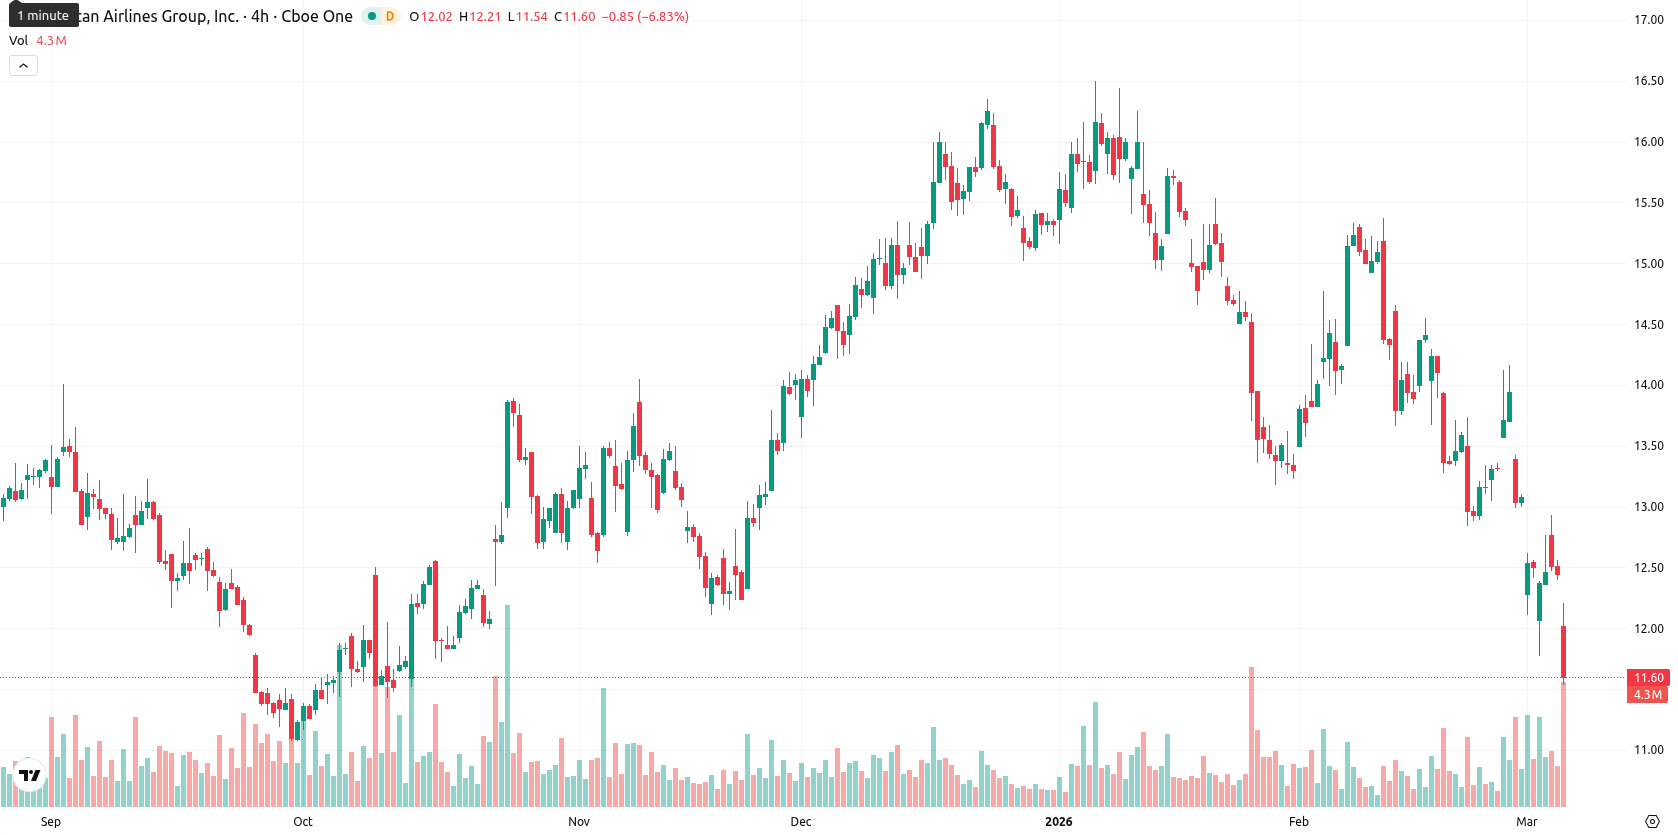
American Airlines Group Inc. (AAL) is trading at $11.58, reflecting a daily decline of 7.10%. The price sits well below the MA-20 ($13.77), MA-50 ($14.56), and MA-200 ($12.96), underscoring sustained pressure from sellers and a persistent bearish tone across all major moving averages.
Highlights
- American Airlines is experiencing consistent selling pressure, with its price trading below major short-, medium-, and long-term moving averages.
- Bearish momentum dominates, as oversold conditions persist across multiple technical indicators and the price posts a steep single-day drop.
- The price is expected to consolidate between $11.35 and $12.15 over the next five days, with a low probability of a rebound.
Oversold signals intensify as sellers dominate below resistance
AAL remains technically weak, trading far below its major moving averages. The Ichimoku Kijun resistance currently stands at $13.58. Momentum indicators support a bearish outlook: MACD signals 'Sell,' ADX is neutral, and oscillators including RSI (37.06), Stochastic RSI (0.00, oversold), and CCI (−113.46, oversold) all suggest deeply oversold conditions. Bull/Bear Power (−0.31, oversold) and the Awesome Oscillator (−1.21) confirm continued dominance by sellers, with price action near the intraday low ($11.55 – $12.19) and heightened volatility reinforcing the downtrend.
Bearish bias prevails as reversal hinges on breakout above resistance
AAL is expected to trade within a typical volatility band of $11.35 to $12.15 over the next five trading days. The probability of a near-term price increase remains low (less than 20%), and further downside is more likely. The baseline scenario is for consolidation between $11.35 and $12.15, with a bullish reversal requiring a sustained breakout above the $13.58 resistance. A drop below $11.35 would indicate renewed bearish momentum.
Last time, analysts noted that American Airlines Group Inc. is exhibiting persistent bearish momentum, trading below key moving averages with all primary technical indicators (RSI, MACD, stochastic, CCI, BBP) reflecting oversold conditions and confirming sustained selling pressure. Resistance is identified near $13.58, with no meaningful support levels highlighted, and the intraday session remains weak amid continued trendless movement and lack of bullish conviction.


Latest American Airlines News


-
 Afghanistan
-
 Albania
-
 Algeria
-
 Angola
-
 Argentina
-
 Armenia
-
 Australia
-
 Austria
-
 Azerbaijan
-
 Bahamas
-
 Bahrain
-
 Bangladesh
-
 Belarus
-
 Belgium
-
 Bolivia
-
 Botswana
-
 Brazil
-
 Brunei
-
 Bulgaria
-
 Cambodia
-
 Cameroon
-
 Canada
-
 Chile
Chile
-
 China
China
-
 Colombia
-
 Congo
Congo
-
 Costa Rica
-
 Cote d'Ivoire
-
 Croatia
-
 Cuba
Cuba
-
 Cyprus
-
 Czechia
-
 DR Congo
-
 Denmark
-
 Dominican Republic
-
 Ecuador
-
 Egypt
Egypt
-
 El Salvador
-
 Estonia
-
 Eswatini
-
 Ethiopia
-
 Finland
-
 France
-
 Georgia
-
 Germany
-
 Ghana
Ghana
-
 Greece
-
 Haiti
Haiti
-
 Hong Kong
-
 Hungary
-
 India
India
-
 Indonesia
-
 Iran, Islamic republic
-
 Iraq
Iraq
-
 Ireland
-
 Israel
-
 Italy
Italy
-
 Jamaica
-
 Japan
Japan
-
 Jordan
-
 Kazakhstan
-
 Kenya
Kenya
-
 Korea
Korea
-
 Kuwait
-
 Kyrgyzstan
-
 Laos
Laos
-
 Latvia
-
 Lebanon
-
 Lesotho
-
 Libya
Libya
-
 Lithuania
-
 Luxembourg
-
 Madagascar
-
 Malaysia
-
 Malta
Malta
-
 Mauritius
-
 Mexico
-
 Moldova
-
 Mongolia
-
 Montenegro
-
 Morocco
-
 Mozambique
-
 Myanmar
-
 Namibia
-
 Nepal
Nepal
-
 Netherlands
-
 New Zealand
-
 Nigeria
-
 North Macedonia
-
 Norway
-
 Oman
Oman
-
 Pakistan
-
 Palestine
-
 Panama
-
 Papua New Guinea
-
 Paraguay
-
 Peru
Peru
-
 Philippines
-
 Poland
-
 Portugal
-
 Puerto Rico
-
 Qatar
Qatar
-
 Reunion
-
 Romania
-
 Rwanda
-
 Saudi Arabia
-
 Serbia
-
 Singapore
-
 Slovakia
-
 Slovenia
-
 Somalia
-
 South Africa
-
 Spain
Spain
-
 Sri Lanka
-
 Sweden
-
 Switzerland
-
 Syria
Syria
-
 Taiwan
-
 Tajikistan
-
 Tanzania
-
 Thailand
-
 Trinidad and Tobago
-
 Tunisia
-
 Turkey
-
 UAE
UAE
-
 Uganda
-
 Ukraine
-
 United Kingdom
-
United States
-
 Uruguay
-
 Uzbekistan
-
 Venezuela
-
 Vietnam
-
 Yemen
Yemen
-
 Zambia
-
 Zimbabwe
- Forex
- Crypto
