
Palantir stock price forecast: Overbought readings spark caution as PLTR loses 1.56%

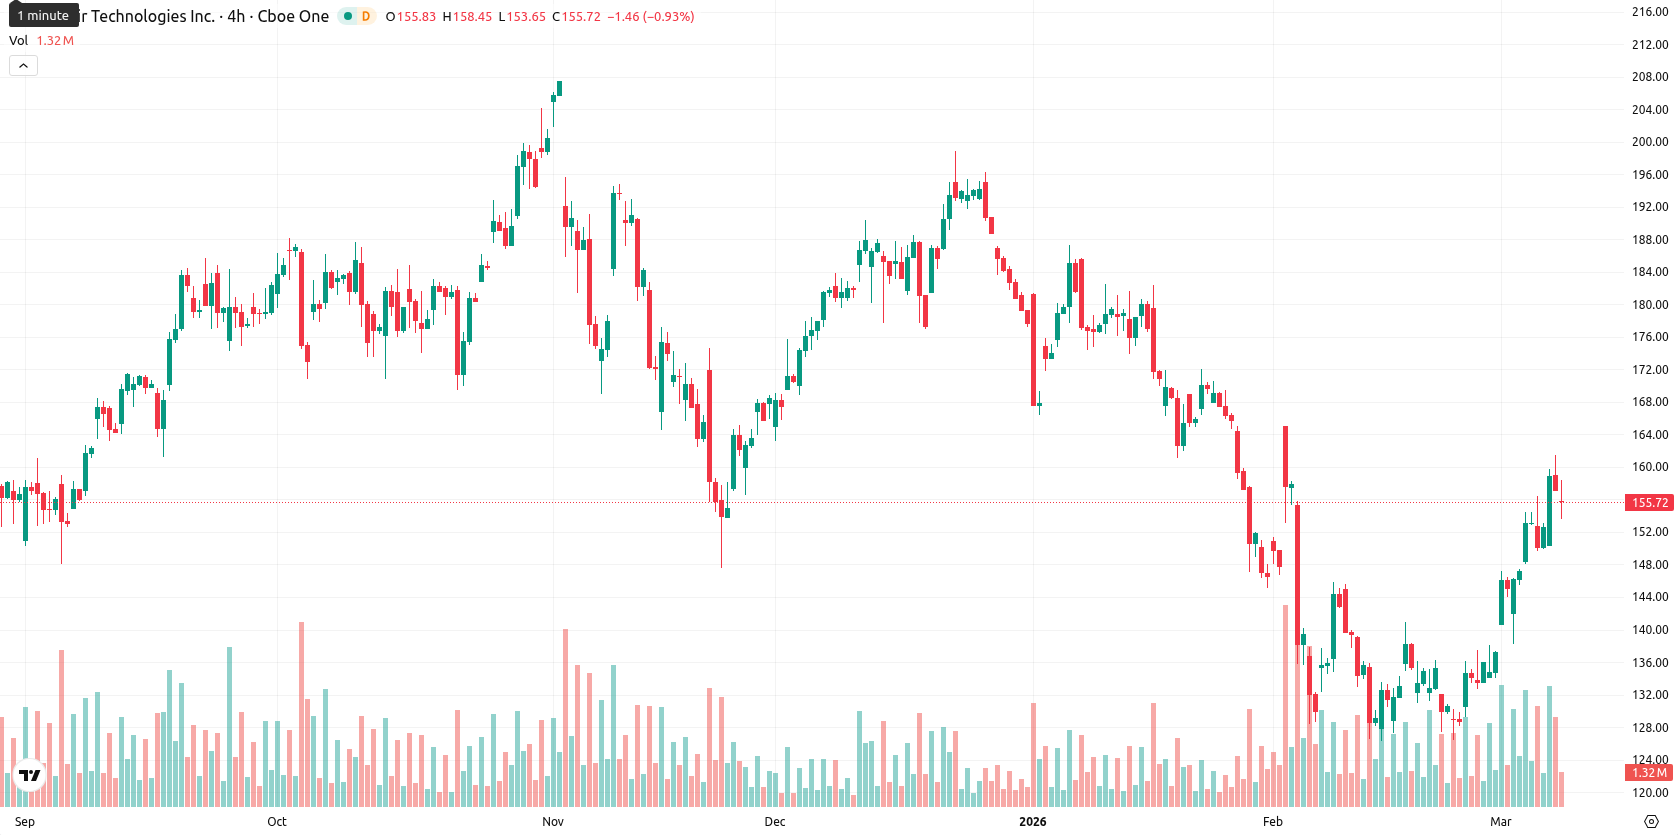
Palantir Technologies Inc (PLTR) is trading at $154.74, positioning the share price above its MA-20 ($138.77), but just below the MA-50 ($157.42) and underneath the MA-200 ($162.07). The current level also sits above the Ichimoku Kijun support at $145.72.
Highlights
- Palantir achieved record quarterly revenue, mainly driven by growth in its U.S. commercial segment and contract wins like Airbus Skywise.
- Recent Pentagon restrictions on Anthropic’s AI create uncertainty around Palantir’s use of Claude code, potentially requiring software adjustments or exemptions.
- PLTR trades in an overbought condition with mixed momentum, seen consolidating between $148.00 and $156.00, and downside risk outweighing short-term rally chances.
Revenue gains and regulatory scrutiny shift sentiment and institutional flows
In recent months, Palantir reported record quarterly revenues, driven especially by its U.S. commercial segment, and announced contract extensions such as with Airbus Skywise. The Pentagon barred U.S. government contractors from using Anthropic’s AI products, raising concerns about aspects of Palantir's software that utilize Claude code, which may now require modifications or exemptions. Institutional activity included Korea Investment CORP increasing its stake, while some investors made small reductions in holdings, though price action has remained under broader selling pressure.
Overbought signals and weak trend strength raise correction risk
Momentum indicators for PLTR remain mixed: the D1 MACD is neutral and ADX shows only a mild uptrend, both reflecting weak conviction. Oscillators present a strongly overbought profile, with Stochastic RSI at 100, a high CCI, Bull/Bear Power signaling continued buyer dominance, and the RSI staying in the buy zone, which underscores positive momentum but flags exhaustion risk. The Awesome Oscillator lends support to the current upward bias; however, today the session logged a $2.45 decrease (down 1.56%) after opening with a small gap up. The price is currently near the lower end of the day’s range, indicating moderate volatility and hinting at renewed downward pressure following an early rally attempt. Divergence between overbought oscillators and weak trend strength increases caution regarding the near-term outlook.
Sideways consolidation likely as overbought state limits upside
PLTR is expected to trade within a $148.00 to $156.00 volatility band relative to current levels over the next five sessions. The probability of further price increases is very low (less than 20%), favoring a likely decline in the short term. The base case calls for PLTR to consolidate sideways in a narrow range. A breakout above $156.00 would require sustained buying, while a move below $148.00 could confirm additional downside, with all scenarios influenced by an overbought setup, fading trend strength, and medium-term resistance.
Previously it was reported that Palantir Technologies is exhibiting short-term strength, trading above its 20-day moving average but remaining below both the 50-day and 200-day averages, indicating broader medium- and long-term resistance. Oscillator readings are overbought while momentum signals are mixed and MACD is negative, suggesting heightened reversal risk and favoring a consolidation or downside scenario unless the price decisively breaks above resistance.


Latest Palantir News


-
 Afghanistan
-
 Albania
-
 Algeria
-
 Angola
-
 Argentina
-
 Armenia
-
 Australia
-
 Austria
-
 Azerbaijan
-
 Bahamas
-
 Bahrain
-
 Bangladesh
-
 Belarus
-
 Belgium
-
 Bolivia
-
 Botswana
-
 Brazil
-
 Brunei
-
 Bulgaria
-
 Cambodia
-
 Cameroon
-
 Canada
-
 Chile
Chile
-
 China
China
-
 Colombia
-
 Congo
Congo
-
 Costa Rica
-
 Cote d'Ivoire
-
 Croatia
-
 Cuba
Cuba
-
 Cyprus
-
 Czechia
-
 DR Congo
-
 Denmark
-
 Dominican Republic
-
 Ecuador
-
 Egypt
Egypt
-
 El Salvador
-
 Estonia
-
 Eswatini
-
 Ethiopia
-
 Finland
-
 France
-
 Georgia
-
 Germany
-
 Ghana
Ghana
-
 Greece
-
 Haiti
Haiti
-
 Hong Kong
-
 Hungary
-
 India
India
-
 Indonesia
-
 Iran, Islamic republic
-
 Iraq
Iraq
-
 Ireland
-
 Israel
-
 Italy
Italy
-
 Jamaica
-
 Japan
Japan
-
 Jordan
-
 Kazakhstan
-
 Kenya
Kenya
-
 Korea
Korea
-
 Kuwait
-
 Kyrgyzstan
-
 Laos
Laos
-
 Latvia
-
 Lebanon
-
 Lesotho
-
 Libya
Libya
-
 Lithuania
-
 Luxembourg
-
 Madagascar
-
 Malaysia
-
 Malta
Malta
-
 Mauritius
-
 Mexico
-
 Moldova
-
 Mongolia
-
 Montenegro
-
 Morocco
-
 Mozambique
-
 Myanmar
-
 Namibia
-
 Nepal
Nepal
-
 Netherlands
-
 New Zealand
-
 Nigeria
-
 North Macedonia
-
 Norway
-
 Oman
Oman
-
 Pakistan
-
 Palestine
-
 Panama
-
 Papua New Guinea
-
 Paraguay
-
 Peru
Peru
-
 Philippines
-
 Poland
-
 Portugal
-
 Puerto Rico
-
 Qatar
Qatar
-
 Reunion
-
 Romania
-
 Rwanda
-
 Saudi Arabia
-
 Serbia
-
 Singapore
-
 Slovakia
-
 Slovenia
-
 Somalia
-
 South Africa
-
 Spain
Spain
-
 Sri Lanka
-
 Sweden
-
 Switzerland
-
 Syria
Syria
-
 Taiwan
-
 Tajikistan
-
 Tanzania
-
 Thailand
-
 Trinidad and Tobago
-
 Tunisia
-
 Turkey
-
 UAE
UAE
-
 Uganda
-
 Ukraine
-
 United Kingdom
-
United States
-
 Uruguay
-
 Uzbekistan
-
 Venezuela
-
 Vietnam
-
 Yemen
Yemen
-
 Zambia
-
 Zimbabwe
- Forex
- Crypto
