
Microsoft stock holds steady as bearish technicals offset strong cloud and AI news

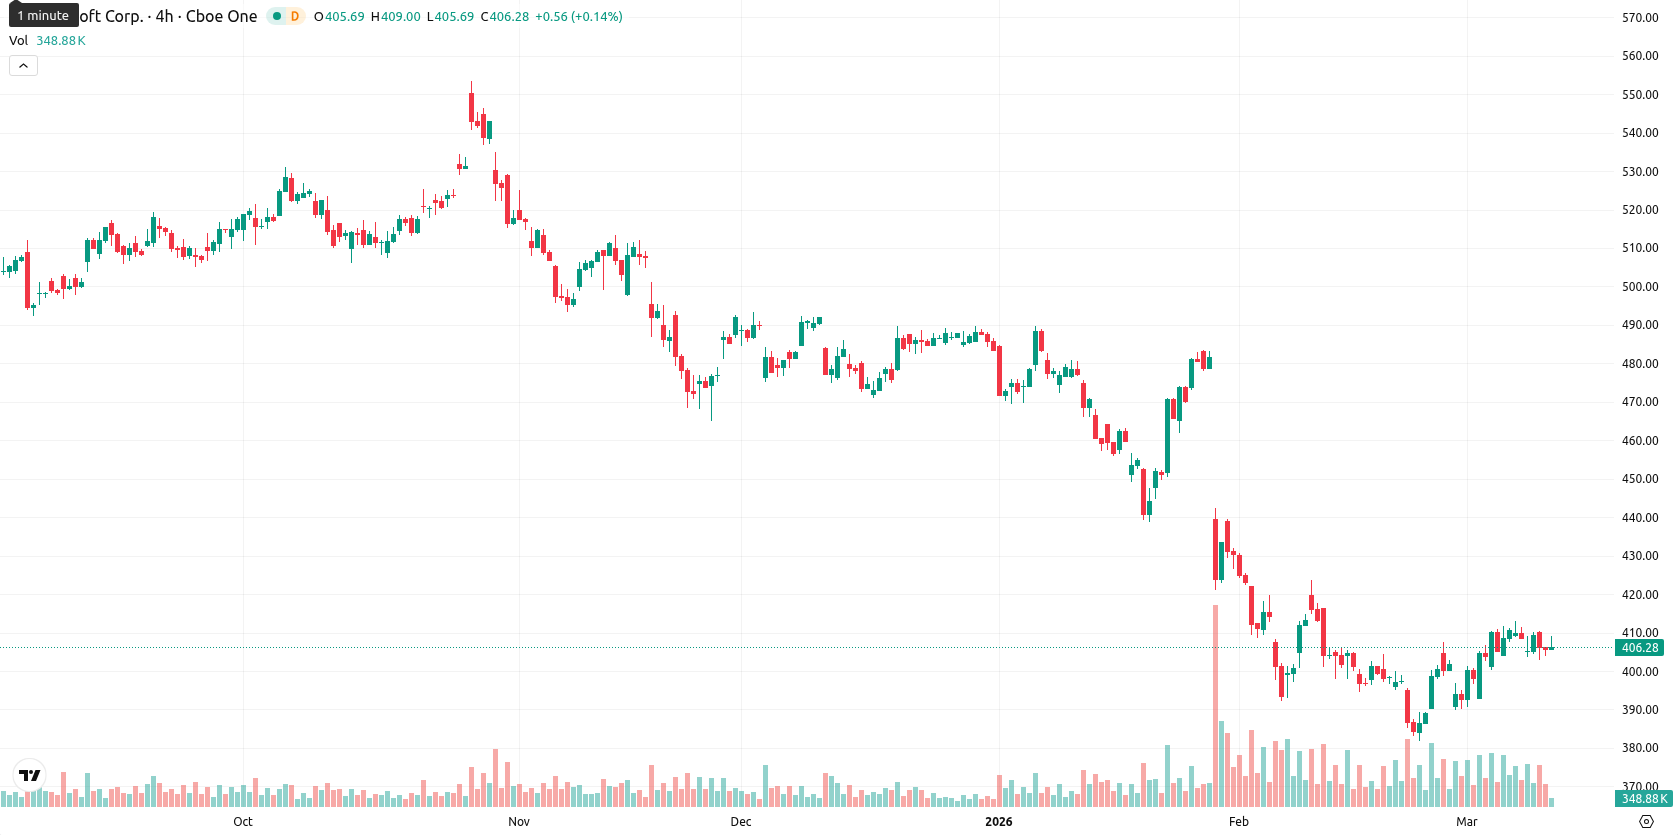
Microsoft Corporation (MSFT) is trading at $406.84 after a modest increase of 0.33% on the day. The current price is above the SMA-20 ($401.16) but remains well below the SMA-50 ($434.55) and SMA-200 ($484.07), showing ongoing medium- and long-term pressure despite short-term support.
Highlights
- Microsoft reported a 39% year-over-year revenue surge in Azure and strong growth in Microsoft 365 Copilot adoption, underscoring robust cloud momentum.
- The company expanded its AI and cloud ecosystem through new global partnerships and announced an $0.91 per share dividend for June.
- Technicals indicate persistent downside risk with likely consolidation between $400–$410, as multiple indicators show bearish momentum and sellers remain in control.
Cloud strength and AI deals drive sentiment amid global partnerships
Microsoft has signed a memorandum of understanding with Codelco to collaborate on advanced analytics and AI for mining operations, initiating an 18-month partnership to improve decision making, autonomous processes, and cybersecurity. The company’s board has declared a $0.91 per share quarterly dividend, payable in June. In addition, strong second quarter results were reported with Azure and other cloud services revenues surging 39% year over year, while Microsoft 365 Copilot reached 15 million paid seats. Microsoft also launched the Frontier suite for Microsoft 365 and expanded its global AI partnerships, including new solutions with Anthropic and a broader collaboration with SpaceX for Azure cloud access.
Mixed overbought signals confront bearish momentum as volatility narrows
MACD and ADX on the daily chart both signal selling pressure, with MACD showing a strong negative reading and ADX confirming a bearish trend. Momentum oscillators are mixed: RSI is moderately weak at 45.12 (Sell), Stoch RSI and Bull/Bear Power (BBP) indicate overbought conditions, while CCI suggests mild buying, signaling exhaustion alongside persistent seller pressure. The daily Ichimoku Kijun stands at $406.23, placing immediate support just below the current price, while daily price action shows a narrow opening gap ($405.50 to $406.64), modest upside, and current price near the midpoint, suggesting moderate volatility and a neutral intraday tone amid strong overbought signals versus negative momentum.
Consolidation likely as persistent bearish signals limit upside
Over the next five trading days, the expected price range is $398.50 to $411.00, corresponding to a typical volatility band of roughly ±3% from the current level. The probability of a price increase is very low (less than 20%), with a decline more likely given persistent bearish signals across RSI-W1, ADX-W1, MACD-W1, and MA-50-W1. The baseline scenario is consolidation between $400 and $410. A bullish outcome would require a breakout above $411.00, while a drop below $398.50 would open further downside potential.
Last time, analysts noted that Microsoft is trading above its short-term moving average but remains below key medium- and long-term averages, signaling a short-term bullish bias within a broader bearish trend. Momentum indicators such as MACD and ADX reflect persistent bearish pressure, with immediate resistance near $409.50 and support around $397–$401, suggesting limited upside potential and a likely period of sideways consolidation.


Latest Microsoft News


-
 Afghanistan
-
 Albania
-
 Algeria
-
 Angola
-
 Argentina
-
 Armenia
-
 Australia
-
 Austria
-
 Azerbaijan
-
 Bahamas
-
 Bahrain
-
 Bangladesh
-
 Belarus
-
 Belgium
-
 Bolivia
-
 Botswana
-
 Brazil
-
 Brunei
-
 Bulgaria
-
 Cambodia
-
 Cameroon
-
 Canada
-
 Chile
Chile
-
 China
China
-
 Colombia
-
 Congo
Congo
-
 Costa Rica
-
 Cote d'Ivoire
-
 Croatia
-
 Cuba
Cuba
-
 Cyprus
-
 Czechia
-
 DR Congo
-
 Denmark
-
 Dominican Republic
-
 Ecuador
-
 Egypt
Egypt
-
 El Salvador
-
 Estonia
-
 Eswatini
-
 Ethiopia
-
 Finland
-
 France
-
 Georgia
-
 Germany
-
 Ghana
Ghana
-
 Greece
-
 Haiti
Haiti
-
 Hong Kong
-
 Hungary
-
 India
India
-
 Indonesia
-
 Iran, Islamic republic
-
 Iraq
Iraq
-
 Ireland
-
 Israel
-
 Italy
Italy
-
 Jamaica
-
 Japan
Japan
-
 Jordan
-
 Kazakhstan
-
 Kenya
Kenya
-
 Korea
Korea
-
 Kuwait
-
 Kyrgyzstan
-
 Laos
Laos
-
 Latvia
-
 Lebanon
-
 Lesotho
-
 Libya
Libya
-
 Lithuania
-
 Luxembourg
-
 Madagascar
-
 Malaysia
-
 Malta
Malta
-
 Mauritius
-
 Mexico
-
 Moldova
-
 Mongolia
-
 Montenegro
-
 Morocco
-
 Mozambique
-
 Myanmar
-
 Namibia
-
 Nepal
Nepal
-
 Netherlands
-
 New Zealand
-
 Nigeria
-
 North Macedonia
-
 Norway
-
 Oman
Oman
-
 Pakistan
-
 Palestine
-
 Panama
-
 Papua New Guinea
-
 Paraguay
-
 Peru
Peru
-
 Philippines
-
 Poland
-
 Portugal
-
 Puerto Rico
-
 Qatar
Qatar
-
 Reunion
-
 Romania
-
 Rwanda
-
 Saudi Arabia
-
 Serbia
-
 Singapore
-
 Slovakia
-
 Slovenia
-
 Somalia
-
 South Africa
-
 Spain
Spain
-
 Sri Lanka
-
 Sweden
-
 Switzerland
-
 Syria
Syria
-
 Taiwan
-
 Tajikistan
-
 Tanzania
-
 Thailand
-
 Trinidad and Tobago
-
 Tunisia
-
 Turkey
-
 UAE
UAE
-
 Uganda
-
 Ukraine
-
 United Kingdom
-
United States
-
 Uruguay
-
 Uzbekistan
-
 Venezuela
-
 Vietnam
-
 Yemen
Yemen
-
 Zambia
-
 Zimbabwe
- Forex
- Crypto
