
Intuit stock price forecast: Bearish pressure as INTU tests key support near $425

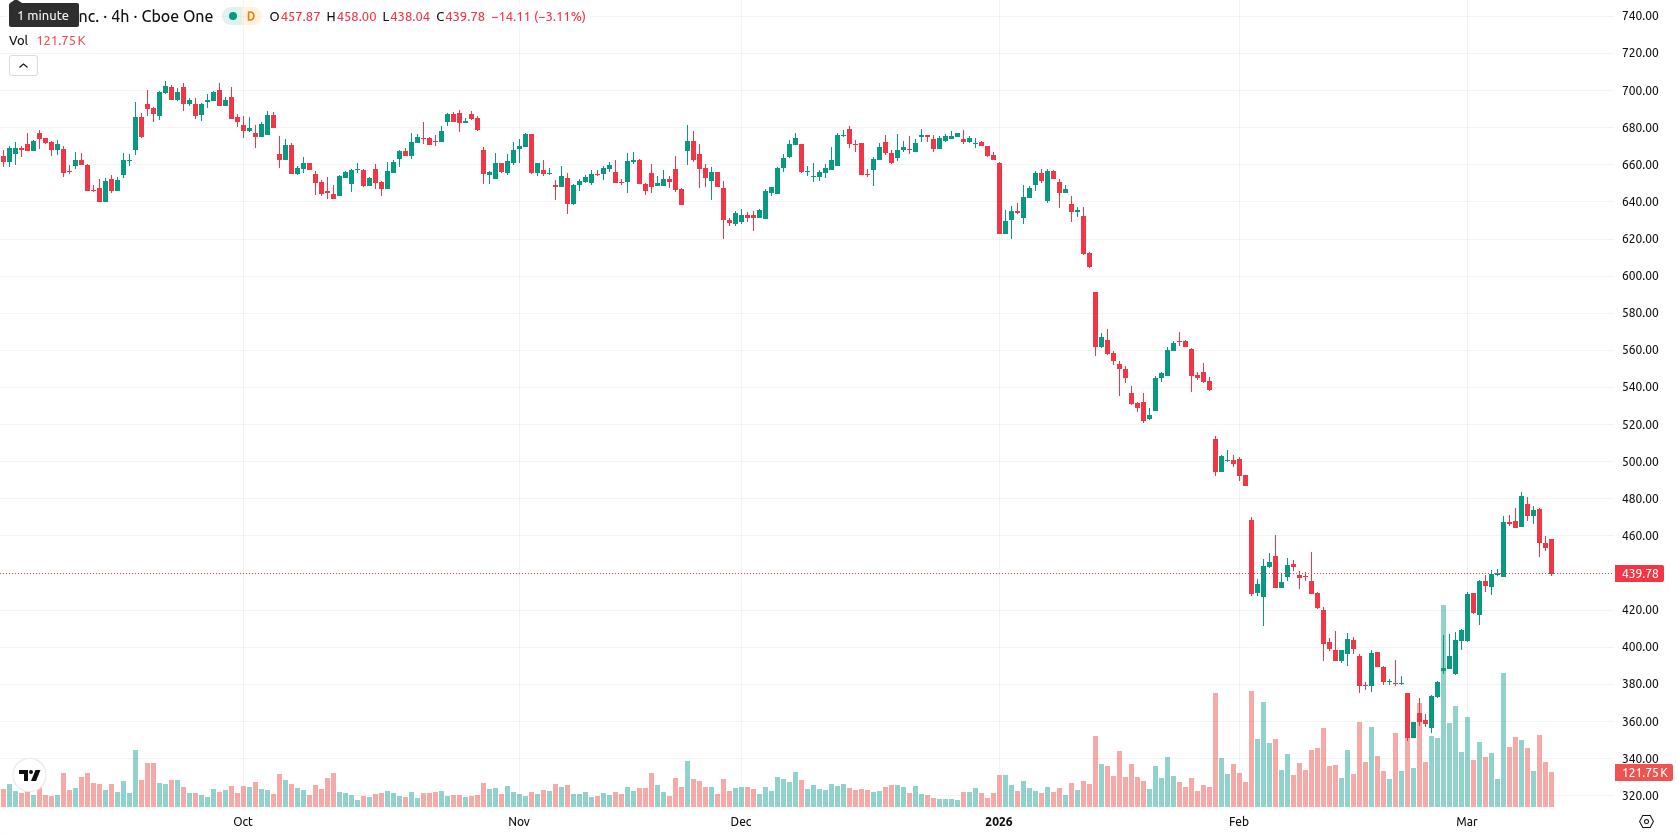
Intuit Inc. (INTU) is trading at $437.10, which is above the MA-20 ($410.98) but well below the MA-50 ($503.34) and MA-200 ($653.12). This positioning suggests short-term stability above the 20-day SMA, while medium- and long-term trends remain under strong bearish pressure from higher averages. The Ichimoku Kijun is at $425.81, meaning immediate resistance is near current price levels.
Highlights
- Intuit lowered Q3 earnings guidance despite 17.4% year-over-year revenue growth in Q2 and a 10% forecast for Q3.
- Management flagged ongoing weakness in the Mailchimp segment but maintained confidence in TurboTax, QuickBooks, and forward double-digit growth targets.
- Technicals indicate prevailing bearish momentum, with trading expected between $416 and $450 and limited probability of near-term gains.
Mixed outlook as lowered guidance and Mailchimp drag on sentiment
Intuit released lowered fiscal third-quarter earnings guidance after reporting 17.4% year-over-year revenue growth in Q2 and forecasting 10% revenue growth for Q3. Continued underperformance in the Mailchimp segment was noted by management, and CEO Sasan Goodarzi reiterated the company’s strategy of integrating AI with human expertise for ongoing product innovation. The resilience of TurboTax and QuickBooks was cited alongside a stable forward-looking outlook for double-digit revenue and margin growth, though price action has remained under broader selling pressure.
Bearish momentum persists as technical indicators diverge on trend strength
Momentum signals are notably bearish: both MACD and ADX D1 indicate persistent downward pressure, supported by strong sell outlooks on multiple timeframes. Oscillator readings are mixed; the D1 RSI sits at a neutral 51.66, while CCI and BBP each signal overbought and buyer dominance, but with daily price action countering this view. Stoch RSI is neutral, while the Awesome Oscillator does not reinforce the current direction. Today, INTU opened fractionally higher at $454.88 versus the previous close of $453.79, but quickly turned down and is now trading near the lower end of the day’s $438.29 – $457.33 range. Volatility has been elevated, with pronounced selling pressure after the open. Diverging oscillator and momentum signals highlight uncertainty, but intraday direction confirms that sellers have regained control.
Downside risk dominates as technical signals weaken bullish case
For the next five trading days, INTU is expected to move between $416 and $450, a range reflecting typical volatility around the current price. The probability of a price increase is very low (less than 20%), with a price decrease being much more likely given the uniform sell signals on weekly MAs, RSI, ADX, and MACD. Baseline scenario: the price remains in a sideways band between support at $425 and resistance at $450. Bullish scenario: a move above immediate resistance at $450 would target higher retracements toward $460. Bearish scenario: a break below the $425 support could expose a slide toward $416 and possibly lower if negative sentiment persists.
Last time, analysts noted that Intuit Inc. is trading above its 20-day moving average but remains well below its 50- and 200-day moving averages, signaling a weak short-term rebound within a dominant medium- and long-term bearish trend. Technical signals, including strong selling pressures confirmed by MACD and ADX, mixed oscillator readings, and heightened intraday volatility, indicate ongoing downward momentum with support near $427.50 and resistance in the $470–$475 range.


-
 Afghanistan
-
 Albania
-
 Algeria
-
 Angola
-
 Argentina
-
 Armenia
-
 Australia
-
 Austria
-
 Azerbaijan
-
 Bahamas
-
 Bahrain
-
 Bangladesh
-
 Belarus
-
 Belgium
-
 Bolivia
-
 Botswana
-
 Brazil
-
 Brunei
-
 Bulgaria
-
 Cambodia
-
 Cameroon
-
 Canada
-
 Chile
Chile
-
 China
China
-
 Colombia
-
 Congo
Congo
-
 Costa Rica
-
 Cote d'Ivoire
-
 Croatia
-
 Cuba
Cuba
-
 Cyprus
-
 Czechia
-
 DR Congo
-
 Denmark
-
 Dominican Republic
-
 Ecuador
-
 Egypt
Egypt
-
 El Salvador
-
 Estonia
-
 Eswatini
-
 Ethiopia
-
 Finland
-
 France
-
 Georgia
-
 Germany
-
 Ghana
Ghana
-
 Greece
-
 Haiti
Haiti
-
 Hong Kong
-
 Hungary
-
 India
India
-
 Indonesia
-
 Iran, Islamic republic
-
 Iraq
Iraq
-
 Ireland
-
 Israel
-
 Italy
Italy
-
 Jamaica
-
 Japan
Japan
-
 Jordan
-
 Kazakhstan
-
 Kenya
Kenya
-
 Korea
Korea
-
 Kuwait
-
 Kyrgyzstan
-
 Laos
Laos
-
 Latvia
-
 Lebanon
-
 Lesotho
-
 Libya
Libya
-
 Lithuania
-
 Luxembourg
-
 Madagascar
-
 Malaysia
-
 Malta
Malta
-
 Mauritius
-
 Mexico
-
 Moldova
-
 Mongolia
-
 Montenegro
-
 Morocco
-
 Mozambique
-
 Myanmar
-
 Namibia
-
 Nepal
Nepal
-
 Netherlands
-
 New Zealand
-
 Nigeria
-
 North Macedonia
-
 Norway
-
 Oman
Oman
-
 Pakistan
-
 Palestine
-
 Panama
-
 Papua New Guinea
-
 Paraguay
-
 Peru
Peru
-
 Philippines
-
 Poland
-
 Portugal
-
 Puerto Rico
-
 Qatar
Qatar
-
 Reunion
-
 Romania
-
 Rwanda
-
 Saudi Arabia
-
 Serbia
-
 Singapore
-
 Slovakia
-
 Slovenia
-
 Somalia
-
 South Africa
-
 Spain
Spain
-
 Sri Lanka
-
 Sweden
-
 Switzerland
-
 Syria
Syria
-
 Taiwan
-
 Tajikistan
-
 Tanzania
-
 Thailand
-
 Trinidad and Tobago
-
 Tunisia
-
 Turkey
-
 UAE
UAE
-
 Uganda
-
 Ukraine
-
 United Kingdom
-
United States
-
 Uruguay
-
 Uzbekistan
-
 Venezuela
-
 Vietnam
-
 Yemen
Yemen
-
 Zambia
-
 Zimbabwe
- Forex
- Crypto
