
Tesla stock price forecast: Persistent selling as TSLA tests support near $370

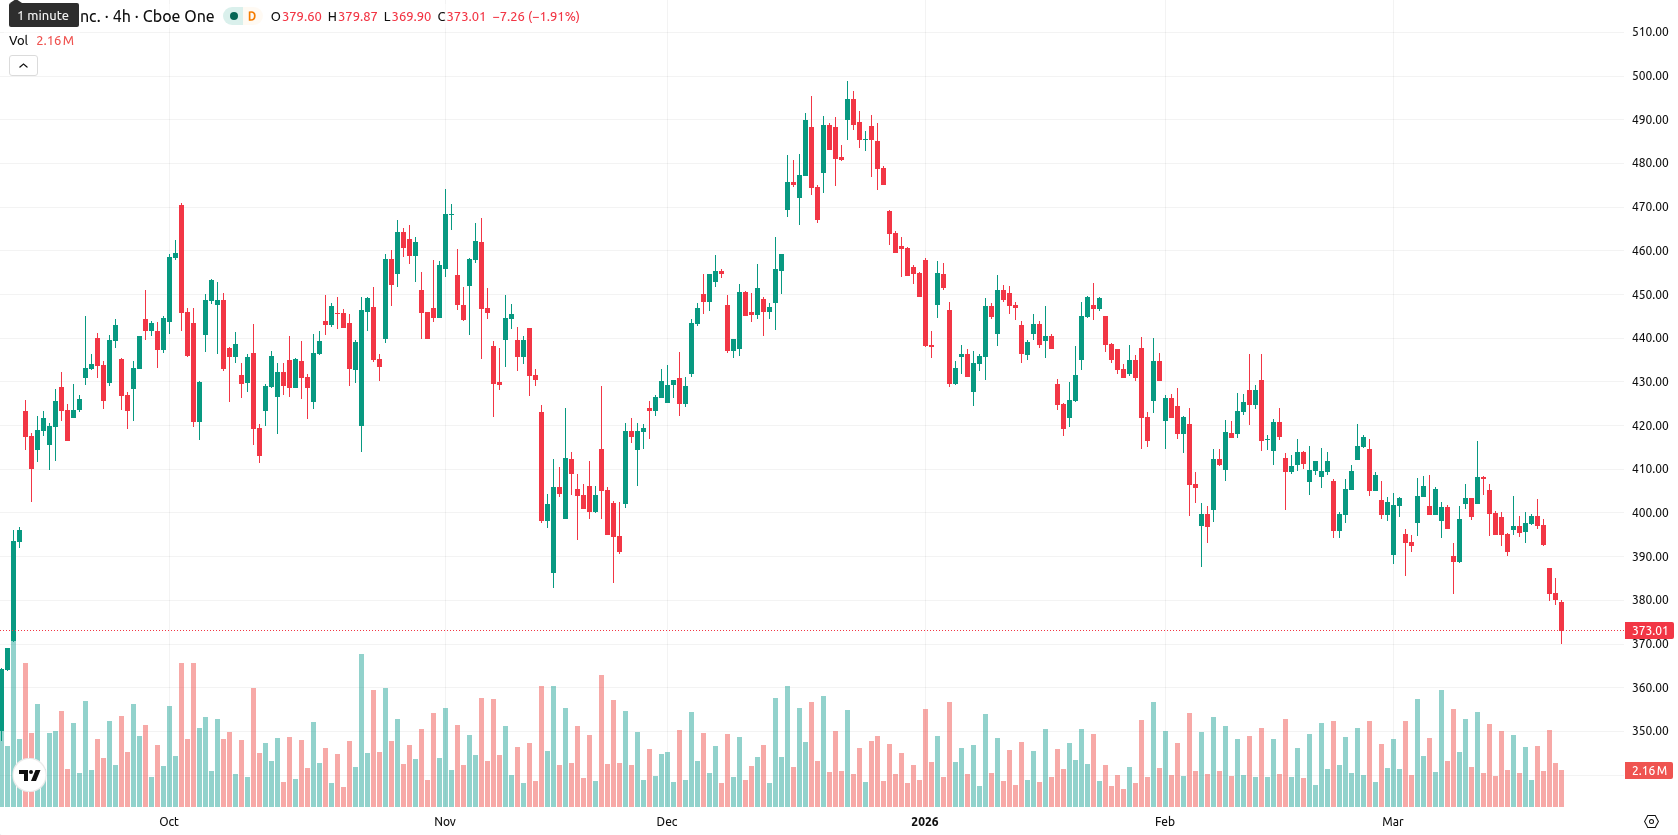
Tesla, Inc. (TSLA) is trading at $373.18, well below the SMA-20 at $400.67, the SMA-50 at $416.56, and the SMA-200 at $394.26, indicating continued downside pressure across short, medium, and long-term moving averages. The Ichimoku Kijun level at $407.60 marks immediate resistance.
Highlights
- NHTSA escalated its probe into 3.2 million Tesla vehicles over Full Self-Driving system compliance but rejected a petition to recall 2.26 million cars, citing insufficient evidence of a broad defect.
- Tesla reported its first annual revenue decline in 2025, posting $94.8 billion in sales and a 9% year-over-year drop in deliveries.
- TSLA trades well below key moving averages with strong bearish momentum, and is expected to remain in a $365–$380 range amid continued selling pressure.
Regulatory scrutiny and revenue decline as growth pressures intensify
On March 19, 2026, the U.S. National Highway Traffic Safety Administration escalated its investigation into 3.2 million Tesla vehicles equipped with Full Self-Driving systems over detection and compliance concerns. The regulator also rejected a petition to recall approximately 2.26 million Tesla cars, citing a lack of evidence of a broader safety defect. Tesla recently reported its first-ever annual revenue decline in 2025, with revenue down 3% to $94.8 billion and vehicle deliveries falling about 9% year-over-year. The company is also launching its Terafab semiconductor fabrication unit to secure chips for robotics and AI applications.
Persistent selling momentum as oversold signals deepen
Momentum indicators show persistent bearish sentiment for TSLA, with both the D1 MACD and ADX signaling continued selling momentum. RSI stands at 36.39, CCI at –219.84, and both Stoch RSI and BBP indicate an oversold market with seller dominance, while the Awesome Oscillator aligns with the ongoing sell-off. Session price action has been volatile — the price opened almost flat but declined by 1.86%, currently near the session low of $370.05, confirming the prevailing bearish tone and aligning with momentum signals.
Downside risk favored as volatility narrows near critical support
In the short term, TSLA is expected to trade within a typical volatility band of $365 to $380 over the next five days. The probability of upward movement is low, at less than 20%, making further decline more likely. The baseline scenario favors continued sideways movement in this corridor, while a decisive break above $380 would challenge immediate resistance but would require stronger momentum. A drop below $365 could indicate additional downside potential given the persistent negative signals and absence of support from higher timeframes.
Previously it was reported that analysts maintained a bearish outlook on Tesla due to persistent selling pressure and unresolved regulatory challenges. The current update reinforces this negative bias with fresh evidence of an oversold market and additional regulator scrutiny, making further downside the primary risk for traders as the $365 level emerges as a critical support to monitor.


Latest Tesla News


-
 Afghanistan
-
 Albania
-
 Algeria
-
 Angola
-
 Argentina
-
 Armenia
-
 Australia
-
 Austria
-
 Azerbaijan
-
 Bahamas
-
 Bahrain
-
 Bangladesh
-
 Belarus
-
 Belgium
-
 Bolivia
-
 Botswana
-
 Brazil
-
 Brunei
-
 Bulgaria
-
 Cambodia
-
 Cameroon
-
 Canada
-
 Chile
Chile
-
 China
China
-
 Colombia
-
 Congo
Congo
-
 Costa Rica
-
 Cote d'Ivoire
-
 Croatia
-
 Cuba
Cuba
-
 Cyprus
-
 Czechia
-
 DR Congo
-
 Denmark
-
 Dominican Republic
-
 Ecuador
-
 Egypt
Egypt
-
 El Salvador
-
 Estonia
-
 Eswatini
-
 Ethiopia
-
 Finland
-
 France
-
 Georgia
-
 Germany
-
 Ghana
Ghana
-
 Greece
-
 Haiti
Haiti
-
 Hong Kong
-
 Hungary
-
 India
India
-
 Indonesia
-
 Iran, Islamic republic
-
 Iraq
Iraq
-
 Ireland
-
 Israel
-
 Italy
Italy
-
 Jamaica
-
 Japan
Japan
-
 Jordan
-
 Kazakhstan
-
 Kenya
Kenya
-
 Korea
Korea
-
 Kuwait
-
 Kyrgyzstan
-
 Laos
Laos
-
 Latvia
-
 Lebanon
-
 Lesotho
-
 Libya
Libya
-
 Lithuania
-
 Luxembourg
-
 Madagascar
-
 Malaysia
-
 Malta
Malta
-
 Mauritius
-
 Mexico
-
 Moldova
-
 Mongolia
-
 Montenegro
-
 Morocco
-
 Mozambique
-
 Myanmar
-
 Namibia
-
 Nepal
Nepal
-
 Netherlands
-
 New Zealand
-
 Nigeria
-
 North Macedonia
-
 Norway
-
 Oman
Oman
-
 Pakistan
-
 Palestine
-
 Panama
-
 Papua New Guinea
-
 Paraguay
-
 Peru
Peru
-
 Philippines
-
 Poland
-
 Portugal
-
 Puerto Rico
-
 Qatar
Qatar
-
 Reunion
-
 Romania
-
 Rwanda
-
 Saudi Arabia
-
 Serbia
-
 Singapore
-
 Slovakia
-
 Slovenia
-
 Somalia
-
 South Africa
-
 Spain
Spain
-
 Sri Lanka
-
 Sweden
-
 Switzerland
-
 Syria
Syria
-
 Taiwan
-
 Tajikistan
-
 Tanzania
-
 Thailand
-
 Trinidad and Tobago
-
 Tunisia
-
 Turkey
-
 UAE
UAE
-
 Uganda
-
 Ukraine
-
 United Kingdom
-
United States
-
 Uruguay
-
 Uzbekistan
-
 Venezuela
-
 Vietnam
-
 Yemen
Yemen
-
 Zambia
-
 Zimbabwe
- Forex
- Crypto
