
AMD stock drops as technical resistance and weak trend dominate session

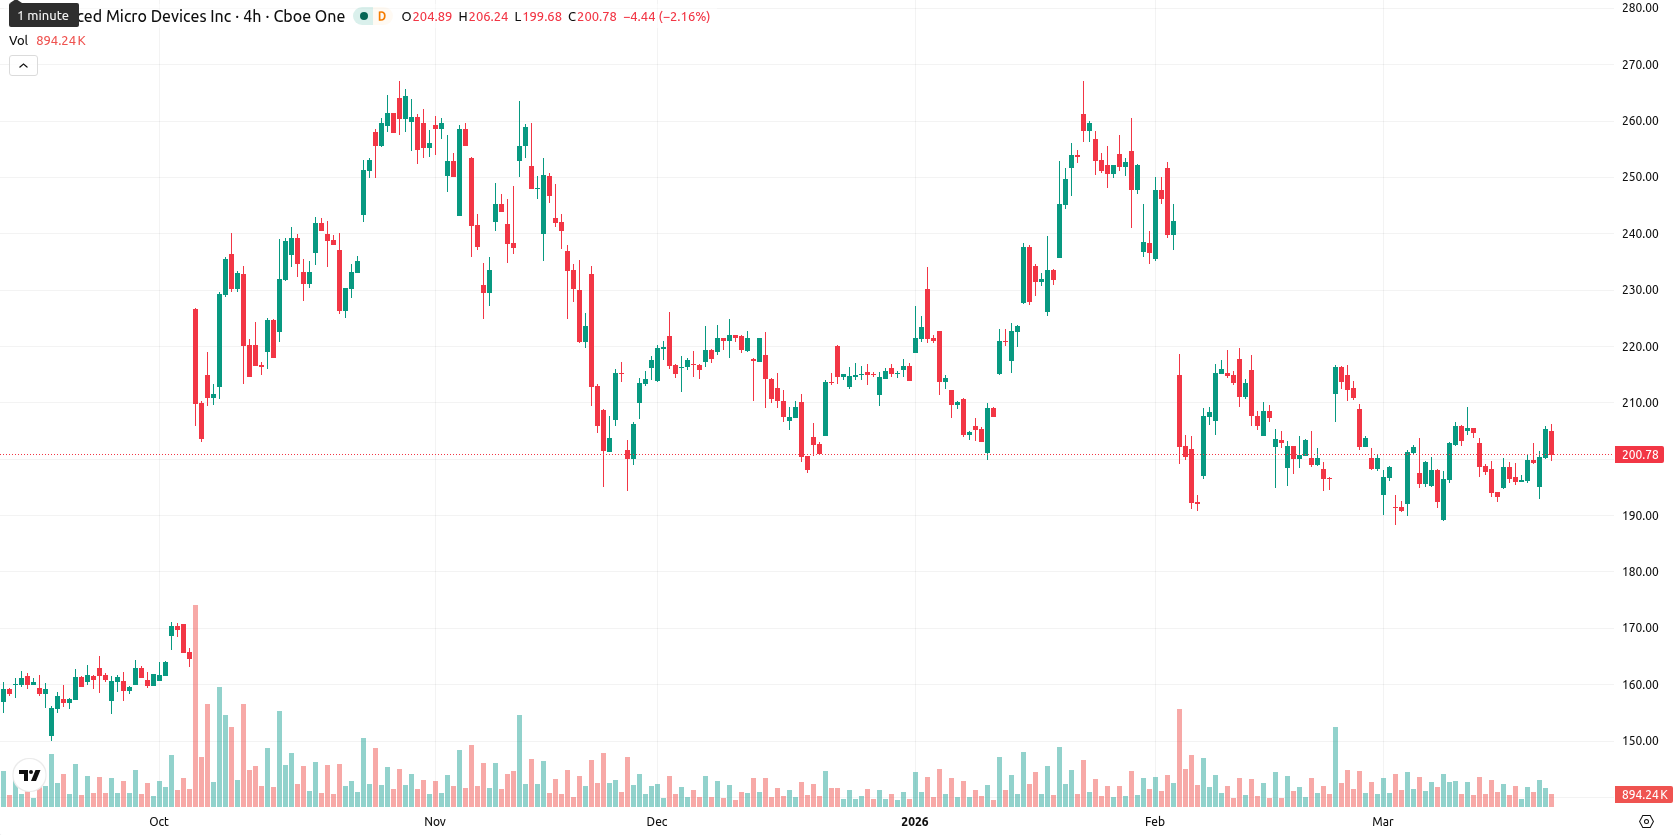
Advanced Micro Devices, Inc. (AMD) is trading at $201.13 after a daily decline of 2.02%. The price is positioned just above the SMA-20 at $200.41, offering short-term support, but remains below the SMA-50 at $214.61, indicating ongoing medium-term selling pressure.
Highlights
- AMD is consolidating near $201 with short-term support at $200 and immediate resistance around $204, reflecting indecisive price action.
- Momentum indicators are mixed, with MACD signaling strong selling pressure, oscillators showing overbought conditions, and trend direction appearing weak.
- Price is expected to remain range-bound between $191 and $211 over the next week, with breakouts above $204 or below $200 setting up the next move.
Mixed momentum and moderate volatility as technical barriers converge
From a technical perspective, AMD is supported by the SMA-20 at $200.41, while the SMA-50 at $214.61 poses resistance in the medium term. The SMA-200, well below at $192.55, preserves a positive long-term trend, and the Ichimoku Kijun at $203.94 presents immediate overhead resistance. Daily momentum indicators are mixed: the MACD signals a strong sell, the ADX reflects a weak and trendless market, RSI sits neutral at 50.88, and both Stoch RSI and Bull/Bear Power (BBP) show overbought conditions, while CCI remains neutral. The session opened with a slight downward gap at $205.00, and with a session range of $199.67 – $206.30, volatility is moderate and momentum leans bearish.
Consolidation likely as breakout risks shape weekly outlook
Over the next five trading days, AMD is expected to fluctuate within a typical volatility band of $191.00 – $211.00 relative to current levels. Weekly indicators suggest a moderate (50%) probability for either upward or downward price movement. The baseline scenario anticipates continued sideways consolidation. Bullish momentum could be renewed with a sustained breakout above the $204 resistance zone, while a break below $200 might trigger further selling toward the $192 support.
Previously it was reported that AMD was experiencing mixed technical momentum and elevated volatility, with caution warranted due to a lack of clear direction. Current conditions reinforce this view, as subdued momentum and ongoing consolidation suggest traders should focus on potential breakouts above $204 or breakdowns below $200 for the next actionable signal.


Latest AMD News


-
 Afghanistan
-
 Albania
-
 Algeria
-
 Angola
-
 Argentina
-
 Armenia
-
 Australia
-
 Austria
-
 Azerbaijan
-
 Bahamas
-
 Bahrain
-
 Bangladesh
-
 Belarus
-
 Belgium
-
 Bolivia
-
 Botswana
-
 Brazil
-
 Brunei
-
 Bulgaria
-
 Cambodia
-
 Cameroon
-
 Canada
-
 Chile
Chile
-
 China
China
-
 Colombia
-
 Congo
Congo
-
 Costa Rica
-
 Cote d'Ivoire
-
 Croatia
-
 Cuba
Cuba
-
 Cyprus
-
 Czechia
-
 DR Congo
-
 Denmark
-
 Dominican Republic
-
 Ecuador
-
 Egypt
Egypt
-
 El Salvador
-
 Estonia
-
 Eswatini
-
 Ethiopia
-
 Finland
-
 France
-
 Georgia
-
 Germany
-
 Ghana
Ghana
-
 Greece
-
 Haiti
Haiti
-
 Hong Kong
-
 Hungary
-
 India
India
-
 Indonesia
-
 Iran, Islamic republic
-
 Iraq
Iraq
-
 Ireland
-
 Israel
-
 Italy
Italy
-
 Jamaica
-
 Japan
Japan
-
 Jordan
-
 Kazakhstan
-
 Kenya
Kenya
-
 Korea
Korea
-
 Kuwait
-
 Kyrgyzstan
-
 Laos
Laos
-
 Latvia
-
 Lebanon
-
 Lesotho
-
 Libya
Libya
-
 Lithuania
-
 Luxembourg
-
 Madagascar
-
 Malaysia
-
 Malta
Malta
-
 Mauritius
-
 Mexico
-
 Moldova
-
 Mongolia
-
 Montenegro
-
 Morocco
-
 Mozambique
-
 Myanmar
-
 Namibia
-
 Nepal
Nepal
-
 Netherlands
-
 New Zealand
-
 Nigeria
-
 North Macedonia
-
 Norway
-
 Oman
Oman
-
 Pakistan
-
 Palestine
-
 Panama
-
 Papua New Guinea
-
 Paraguay
-
 Peru
Peru
-
 Philippines
-
 Poland
-
 Portugal
-
 Puerto Rico
-
 Qatar
Qatar
-
 Reunion
-
 Romania
-
 Rwanda
-
 Saudi Arabia
-
 Serbia
-
 Singapore
-
 Slovakia
-
 Slovenia
-
 Somalia
-
 South Africa
-
 Spain
Spain
-
 Sri Lanka
-
 Sweden
-
 Switzerland
-
 Syria
Syria
-
 Taiwan
-
 Tajikistan
-
 Tanzania
-
 Thailand
-
 Trinidad and Tobago
-
 Tunisia
-
 Turkey
-
 UAE
UAE
-
 Uganda
-
 Ukraine
-
 United Kingdom
-
United States
-
 Uruguay
-
 Uzbekistan
-
 Venezuela
-
 Vietnam
-
 Yemen
Yemen
-
 Zambia
-
 Zimbabwe
- Forex
- Crypto
