
+3.60% for American Airlines stock as sellers dominate despite intraday volatility

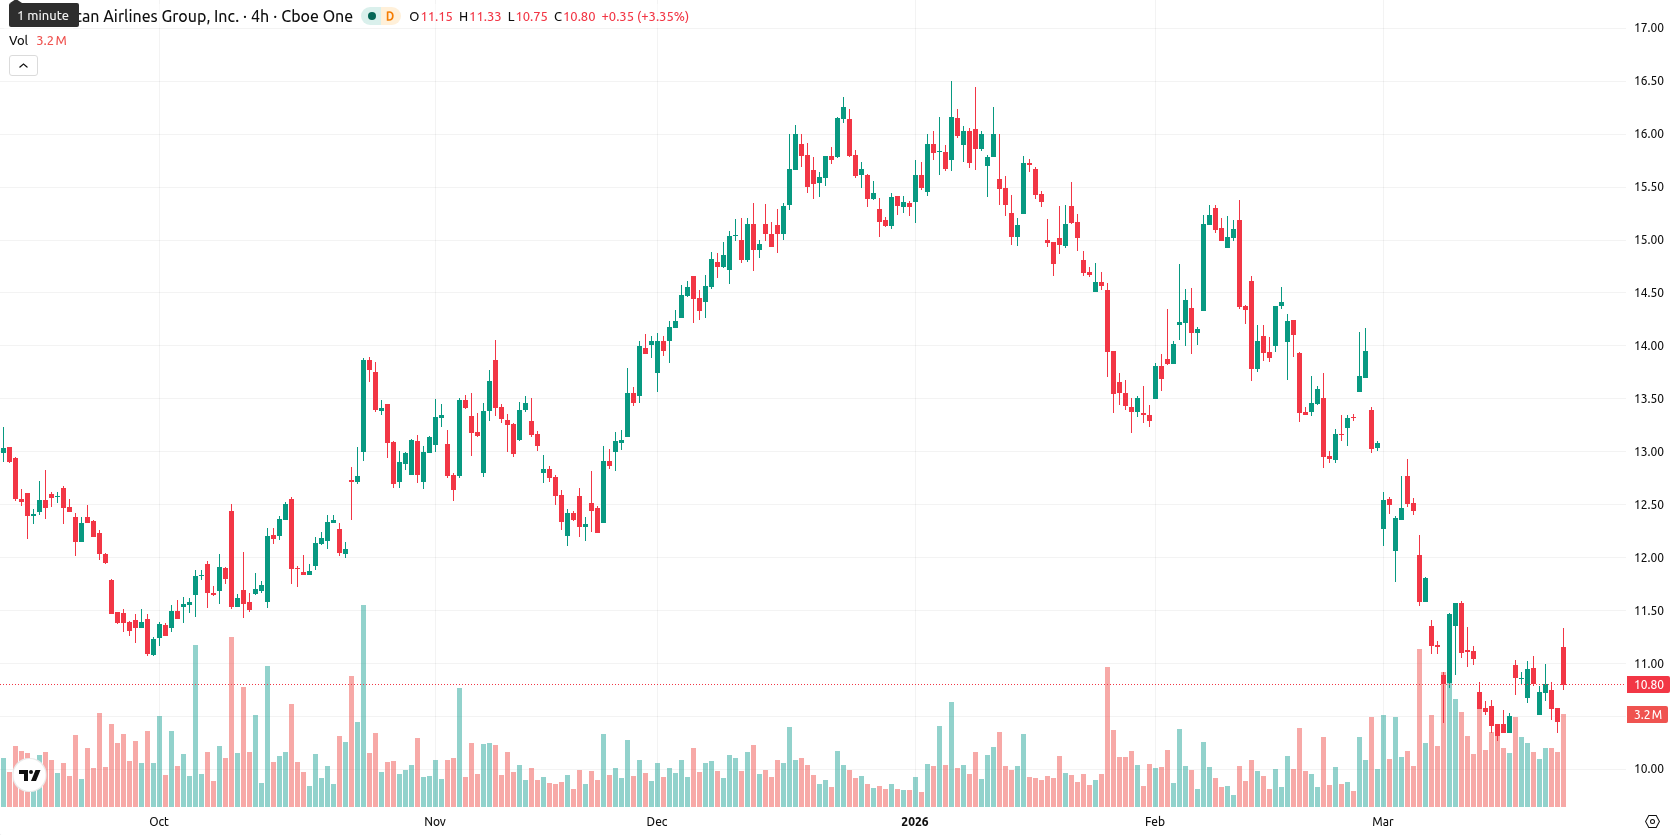
American Airlines Group Inc. (AAL) is trading at $10.81, moving up 3.60% on the day. The price remains below major moving averages, signaling continued selling pressure across short-, medium-, and long-term trends.
Highlights
- AAL trades below all key moving averages, indicating persistent selling pressure across multiple timeframes.
- Momentum and trend indicators are unanimously bearish, with oversold conditions suggesting strong downside bias but limited immediate rebound potential.
- Price is forecast to fluctuate between $10.60 and $11.10 over the next week, with low odds of recovery and high probability of continued weakness unless resistance at $12.46 breaks.
Oversold signs rise as momentum remains firmly bearish
AAL’s current price of $10.81 is below the MA-20 ($11.73), MA-50 ($13.43), and MA-200 ($12.93), indicating ongoing short-, medium-, and long-term selling pressure. The Ichimoku Kijun sits at $12.46, which is immediate resistance above current levels. On the momentum side, both MACD (Strong Sell, -1.09) and ADX (27.90, Sell) confirm weak bearish momentum. RSI (30.82, Sell), Stoch RSI (Sell, 43.50), and CCI (-80.92, Sell) are each in or near oversold territory, suggesting strong seller control but that the price is approaching technically stressed levels. BBP is negative and oversold (-0.36), indicating sellers dominate intraday flows. Today’s session opened with a significant gap up from $10.43 to $11.24, but the price has faded from the open and now trades near the session's low ($10.77), implying high volatility and continued downward pressure after the initial strength. Several oscillators hint at an oversold state, while momentum readings remain bearish, highlighting a short-term divergence that tempers confidence in a swift rebound.
Limited upside as volatility supports sideways-to-down trend
For the next five trading days, a price corridor between $10.60 and $11.10 is likely, with the band reflecting typical volatility relative to current levels. The probability of a price increase remains very low (less than 20%), while momentum and weekly trend indicators strongly favor a downward or sideways bias. In the baseline scenario, AAL may move sideways in this tight band as oversold signals potentially slow further declines. A break above $12.46 (Kijun resistance) would open a bullish scenario, while a drop below $10.60 could occur if selling accelerates.
Earlier, analysts noted that American Airlines was experiencing entrenched selling pressure and sustained bearish momentum across most technical indicators. The current analysis strengthens this view, with fresh oversold signals and persistent volatility now spotlighting $12.46 as the critical resistance level that could shift the outlook if breached.


Latest American Airlines News


-
 Afghanistan
-
 Albania
-
 Algeria
-
 Angola
-
 Argentina
-
 Armenia
-
 Australia
-
 Austria
-
 Azerbaijan
-
 Bahamas
-
 Bahrain
-
 Bangladesh
-
 Belarus
-
 Belgium
-
 Bolivia
-
 Botswana
-
 Brazil
-
 Brunei
-
 Bulgaria
-
 Cambodia
-
 Cameroon
-
 Canada
-
 Chile
Chile
-
 China
China
-
 Colombia
-
 Congo
Congo
-
 Costa Rica
-
 Cote d'Ivoire
-
 Croatia
-
 Cuba
Cuba
-
 Cyprus
-
 Czechia
-
 DR Congo
-
 Denmark
-
 Dominican Republic
-
 Ecuador
-
 Egypt
Egypt
-
 El Salvador
-
 Estonia
-
 Eswatini
-
 Ethiopia
-
 Finland
-
 France
-
 Georgia
-
 Germany
-
 Ghana
Ghana
-
 Greece
-
 Haiti
Haiti
-
 Hong Kong
-
 Hungary
-
 India
India
-
 Indonesia
-
 Iran, Islamic republic
-
 Iraq
Iraq
-
 Ireland
-
 Israel
-
 Italy
Italy
-
 Jamaica
-
 Japan
Japan
-
 Jordan
-
 Kazakhstan
-
 Kenya
Kenya
-
 Korea
Korea
-
 Kuwait
-
 Kyrgyzstan
-
 Laos
Laos
-
 Latvia
-
 Lebanon
-
 Lesotho
-
 Libya
Libya
-
 Lithuania
-
 Luxembourg
-
 Madagascar
-
 Malaysia
-
 Malta
Malta
-
 Mauritius
-
 Mexico
-
 Moldova
-
 Mongolia
-
 Montenegro
-
 Morocco
-
 Mozambique
-
 Myanmar
-
 Namibia
-
 Nepal
Nepal
-
 Netherlands
-
 New Zealand
-
 Nigeria
-
 North Macedonia
-
 Norway
-
 Oman
Oman
-
 Pakistan
-
 Palestine
-
 Panama
-
 Papua New Guinea
-
 Paraguay
-
 Peru
Peru
-
 Philippines
-
 Poland
-
 Portugal
-
 Puerto Rico
-
 Qatar
Qatar
-
 Reunion
-
 Romania
-
 Rwanda
-
 Saudi Arabia
-
 Serbia
-
 Singapore
-
 Slovakia
-
 Slovenia
-
 Somalia
-
 South Africa
-
 Spain
Spain
-
 Sri Lanka
-
 Sweden
-
 Switzerland
-
 Syria
Syria
-
 Taiwan
-
 Tajikistan
-
 Tanzania
-
 Thailand
-
 Trinidad and Tobago
-
 Tunisia
-
 Turkey
-
 UAE
UAE
-
 Uganda
-
 Ukraine
-
 United Kingdom
-
United States
-
 Uruguay
-
 Uzbekistan
-
 Venezuela
-
 Vietnam
-
 Yemen
Yemen
-
 Zambia
-
 Zimbabwe
- Forex
- Crypto
