
Microsoft stock slips 1.74% as oversold signals and bearish momentum intensify

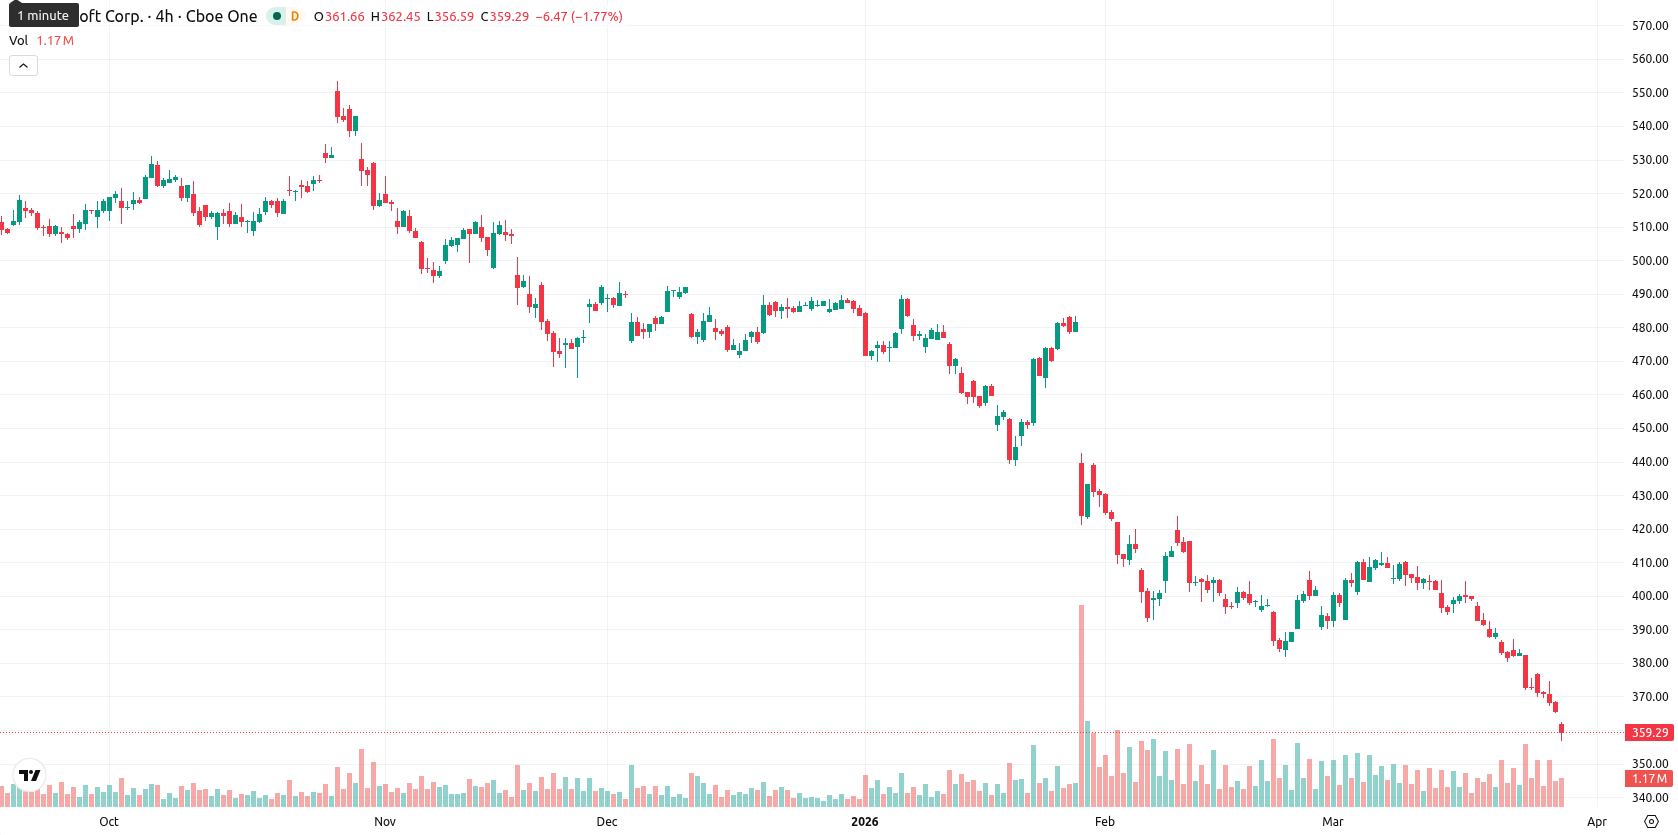
Microsoft Corporation (MSFT) is trading at $359.43 after a daily drop of 1.74%. The asset remains well below the SMA-20 ($394.58), SMA-50 ($412.51), and SMA-200 ($479.64), underscoring persistent downward momentum across all key timeframes.
Highlights
- Microsoft's Azure division posted strong revenue growth driven by expanded cloud and AI offerings, including new Copilot agents and a $99 Microsoft 365 E7 plan in Korea.
- Dividend increases and buybacks remain on track, but cloud sector faces headwinds from elevated infrastructure costs to support advanced AI services.
- MSFT trades well below key moving averages amid persistent bearish momentum, with a near-term range expected between $352.00 and $370.00 and very high downside risk.
Azure revenue strength checked by high AI costs and selling pressure
Microsoft has continued to expand its Azure cloud platform and integrated artificial intelligence technologies across its product lineup. The company maintained its strategy of dividend growth and share buybacks, supported by its competitive position in cloud and AI services. Recently, Microsoft introduced Copilot agents and launched the $99 Microsoft 365 E7 plan in Korea to further corporate AI adoption, while expanding its global cloud infrastructure with the opening of the Denmark East cloud region. Robust revenue growth in Azure was reported, accompanied by industry-wide challenges related to high infrastructure costs for advanced AI workloads, though price action has remained under broader selling pressure.
Oversold signals intensify as intraday lows and volatility rise
Momentum remains negative on the daily timeframe as signaled by MACD and ADX, with the price trading below SMA-20, SMA-50, and SMA-200, confirming broad-based downside pressure. The Ichimoku Kijun at $389.12 sets immediate resistance, while key support is found near $356.00. Oversold readings are evident in RSI (25.88), Stoch RSI (0.00), and CCI (–175.17), and BBP (–10.64) alongside the Awesome Oscillator corroborate sustained selling dominance intraday. The session opened with a gap down and Microsoft is trading near its daily lows, reflecting high intraday volatility and continued bearish momentum.
Downside risk dominates as tight consolidation precedes breakout move
For the next five trading days, the typical volatility band is expected between $352.00 and $370.00, relative to current levels. There is a very high probability (over 80%) of continued downside, with less likelihood of a reversal to the upside. The base scenario anticipates sideways consolidation between immediate support and resistance, while a bullish case would require a break above $389.00. A sustained move below $356.00 could open the way for accelerated losses toward lower support levels.
Earlier, analysts noted that Microsoft faced persistent bearish momentum amid technical weakness and heightened risks from competition in AI partnerships. The current assessment reinforces this outlook with continued downside pressure, and traders should closely monitor $356.00 as a critical support level that could determine whether further declines materialize.


Latest Microsoft News


-
 Afghanistan
-
 Albania
-
 Algeria
-
 Angola
-
 Argentina
-
 Armenia
-
 Australia
-
 Austria
-
 Azerbaijan
-
 Bahamas
-
 Bahrain
-
 Bangladesh
-
 Belarus
-
 Belgium
-
 Bolivia
-
 Botswana
-
 Brazil
-
 Brunei
-
 Bulgaria
-
 Cambodia
-
 Cameroon
-
 Canada
-
 Chile
Chile
-
 China
China
-
 Colombia
-
 Congo
Congo
-
 Costa Rica
-
 Cote d'Ivoire
-
 Croatia
-
 Cuba
Cuba
-
 Cyprus
-
 Czechia
-
 DR Congo
-
 Denmark
-
 Dominican Republic
-
 Ecuador
-
 Egypt
Egypt
-
 El Salvador
-
 Estonia
-
 Eswatini
-
 Ethiopia
-
 Finland
-
 France
-
 Georgia
-
 Germany
-
 Ghana
Ghana
-
 Greece
-
 Haiti
Haiti
-
 Hong Kong
-
 Hungary
-
 India
India
-
 Indonesia
-
 Iran, Islamic republic
-
 Iraq
Iraq
-
 Ireland
-
 Israel
-
 Italy
Italy
-
 Jamaica
-
 Japan
Japan
-
 Jordan
-
 Kazakhstan
-
 Kenya
Kenya
-
 Korea
Korea
-
 Kuwait
-
 Kyrgyzstan
-
 Laos
Laos
-
 Latvia
-
 Lebanon
-
 Lesotho
-
 Libya
Libya
-
 Lithuania
-
 Luxembourg
-
 Madagascar
-
 Malaysia
-
 Malta
Malta
-
 Mauritius
-
 Mexico
-
 Moldova
-
 Mongolia
-
 Montenegro
-
 Morocco
-
 Mozambique
-
 Myanmar
-
 Namibia
-
 Nepal
Nepal
-
 Netherlands
-
 New Zealand
-
 Nigeria
-
 North Macedonia
-
 Norway
-
 Oman
Oman
-
 Pakistan
-
 Palestine
-
 Panama
-
 Papua New Guinea
-
 Paraguay
-
 Peru
Peru
-
 Philippines
-
 Poland
-
 Portugal
-
 Puerto Rico
-
 Qatar
Qatar
-
 Reunion
-
 Romania
-
 Rwanda
-
 Saudi Arabia
-
 Serbia
-
 Singapore
-
 Slovakia
-
 Slovenia
-
 Somalia
-
 South Africa
-
 Spain
Spain
-
 Sri Lanka
-
 Sweden
-
 Switzerland
-
 Syria
Syria
-
 Taiwan
-
 Tajikistan
-
 Tanzania
-
 Thailand
-
 Trinidad and Tobago
-
 Tunisia
-
 Turkey
-
 UAE
UAE
-
 Uganda
-
 Ukraine
-
 United Kingdom
-
United States
-
 Uruguay
-
 Uzbekistan
-
 Venezuela
-
 Vietnam
-
 Yemen
Yemen
-
 Zambia
-
 Zimbabwe
- Forex
- Crypto
