
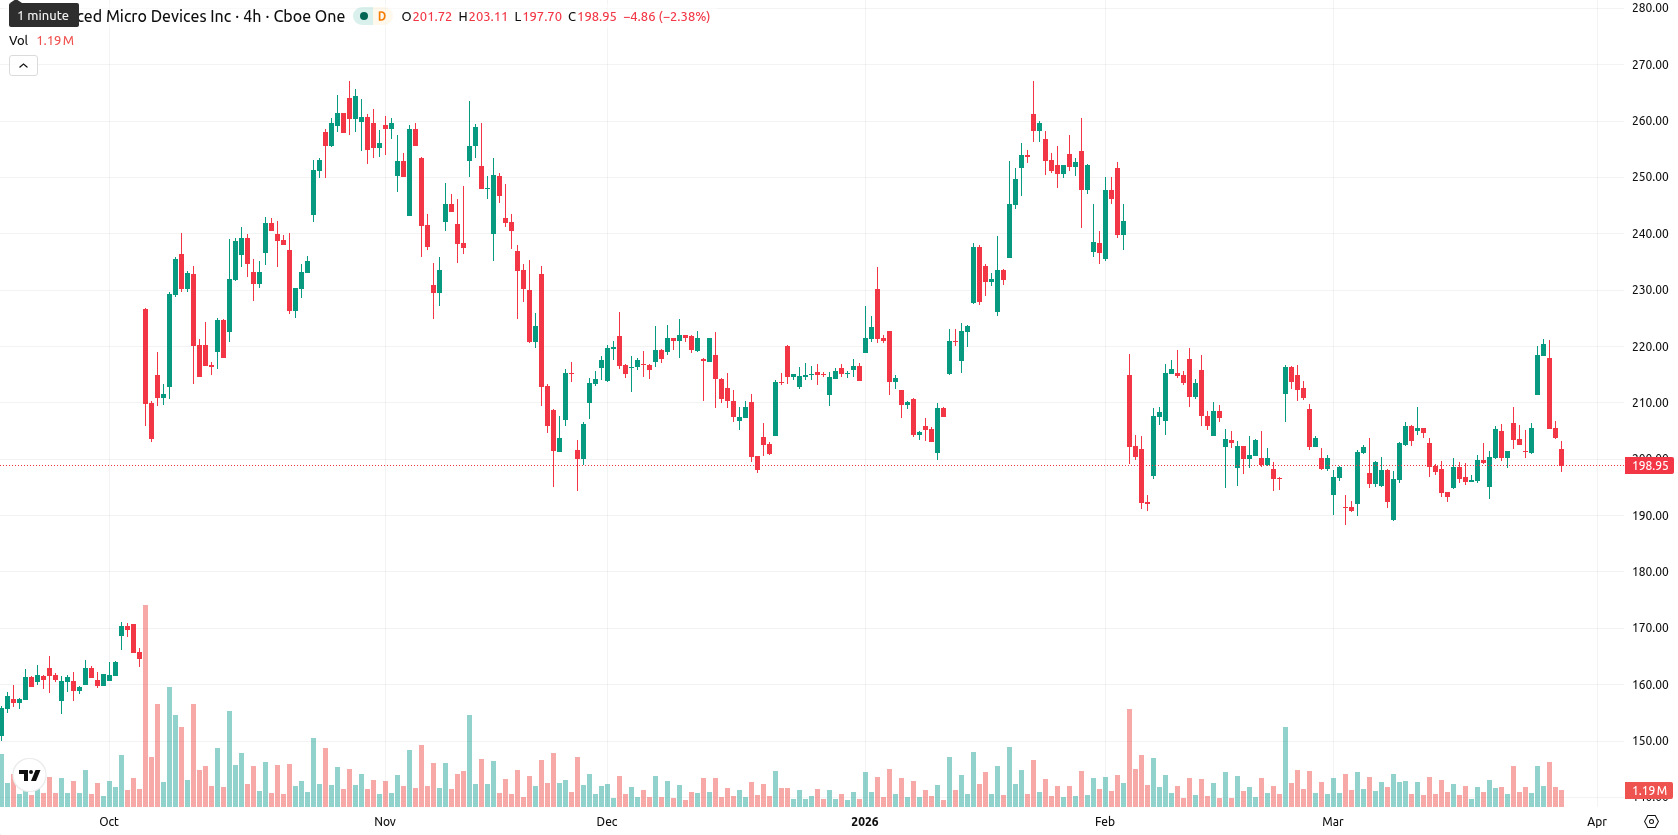
AMD stock falls after strong rally triggers investor rotation and mixed momentum signals

Advanced Micro Devices, Inc. (AMD) is trading at $200.32, just below its MA-20 ($200.83), notably under the MA-50 ($214.35), but above the MA-200 ($194.76), indicating short-term selling pressure, ongoing medium-term weakness, and longer-term support. The Ichimoku Kijun at $204.78 is acting as immediate resistance.
Highlights
- AMD shares declined as investors took profits following a recent surge, amid broader chip sector weakness.
- The market move was driven by shifts in investor positioning, with no new company-specific developments reported.
- Technicals indicate short-term seller pressure and mixed momentum, with AMD expected to range between $198.00 and $211.00.
Profit-taking amid chip sector weakness drives positioning shift
AMD stock was affected by a wave of profit-taking after a recent surge. The move coincided with reported weakness in the broader chip sector. No further company-specific events were reported, and activity was largely attributed to shifts in investor positioning.
Diverging indicators signal weak momentum against overbought backdrop
Momentum is neutral to weak, as seen from neutral signals on the D1 MACD and ADX. The RSI reads 49.23, slightly bearish, while the Stoch RSI gives a strong sell signal and CCI shows overbought conditions, pointing to mixed short-term sentiment. BBP suggests an overbought market with only slight buyer dominance. Price action was marked by a 1.70% daily drop, an opening gap down, and trading near the lower end of the day's range, reflecting moderate volatility and ongoing selling, with overbought readings clashing with weak momentum to highlight indicator divergence.
Sideways trend likely as strong weekly signals counter downside risk
Over the next five trading days, AMD is expected to move within a volatility band of $198.00 to $211.00, keeping the current price in the center and reflecting typical volatility for the stock. Strong weekly uptrends in the MA-50, MA-100, and MA-200, combined with weekly RSI and MACD buy signals, point to an over 80% probability of price gains, making declines less likely in the near term. The baseline scenario calls for continued sideways trading within this range. A close above $204.78 would shift the momentum bullishly toward the upper band, while a break below $198.00 could trigger a bearish move toward MA-200 support.
Earlier, analysts noted that AMD was experiencing persistent bullish momentum but warned of possible trend reversals amid technical divergences. The latest price action and indicator mix reinforce the need for caution, with traders advised to monitor $204.78 as a decisive resistance level that could define the near-term direction.


Latest AMD News


-
 Afghanistan
-
 Albania
-
 Algeria
-
 Angola
-
 Argentina
-
 Armenia
-
 Australia
-
 Austria
-
 Azerbaijan
-
 Bahamas
-
 Bahrain
-
 Bangladesh
-
 Belarus
-
 Belgium
-
 Bolivia
-
 Botswana
-
 Brazil
-
 Brunei
-
 Bulgaria
-
 Cambodia
-
 Cameroon
-
 Canada
-
 Chile
Chile
-
 China
China
-
 Colombia
-
 Congo
Congo
-
 Costa Rica
-
 Cote d'Ivoire
-
 Croatia
-
 Cuba
Cuba
-
 Cyprus
-
 Czechia
-
 DR Congo
-
 Denmark
-
 Dominican Republic
-
 Ecuador
-
 Egypt
Egypt
-
 El Salvador
-
 Estonia
-
 Eswatini
-
 Ethiopia
-
 Finland
-
 France
-
 Georgia
-
 Germany
-
 Ghana
Ghana
-
 Greece
-
 Haiti
Haiti
-
 Hong Kong
-
 Hungary
-
 India
India
-
 Indonesia
-
 Iran, Islamic republic
-
 Iraq
Iraq
-
 Ireland
-
 Israel
-
 Italy
Italy
-
 Jamaica
-
 Japan
Japan
-
 Jordan
-
 Kazakhstan
-
 Kenya
Kenya
-
 Korea
Korea
-
 Kuwait
-
 Kyrgyzstan
-
 Laos
Laos
-
 Latvia
-
 Lebanon
-
 Lesotho
-
 Libya
Libya
-
 Lithuania
-
 Luxembourg
-
 Madagascar
-
 Malaysia
-
 Malta
Malta
-
 Mauritius
-
 Mexico
-
 Moldova
-
 Mongolia
-
 Montenegro
-
 Morocco
-
 Mozambique
-
 Myanmar
-
 Namibia
-
 Nepal
Nepal
-
 Netherlands
-
 New Zealand
-
 Nigeria
-
 North Macedonia
-
 Norway
-
 Oman
Oman
-
 Pakistan
-
 Palestine
-
 Panama
-
 Papua New Guinea
-
 Paraguay
-
 Peru
Peru
-
 Philippines
-
 Poland
-
 Portugal
-
 Puerto Rico
-
 Qatar
Qatar
-
 Reunion
-
 Romania
-
 Rwanda
-
 Saudi Arabia
-
 Serbia
-
 Singapore
-
 Slovakia
-
 Slovenia
-
 Somalia
-
 South Africa
-
 Spain
Spain
-
 Sri Lanka
-
 Sweden
-
 Switzerland
-
 Syria
Syria
-
 Taiwan
-
 Tajikistan
-
 Tanzania
-
 Thailand
-
 Trinidad and Tobago
-
 Tunisia
-
 Turkey
-
 UAE
UAE
-
 Uganda
-
 Ukraine
-
 United Kingdom
-
United States
-
 Uruguay
-
 Uzbekistan
-
 Venezuela
-
 Vietnam
-
 Yemen
Yemen
-
 Zambia
-
 Zimbabwe
- Forex
- Crypto
