
Hut 8 stock advances as strong uptrend lifts price above key averages

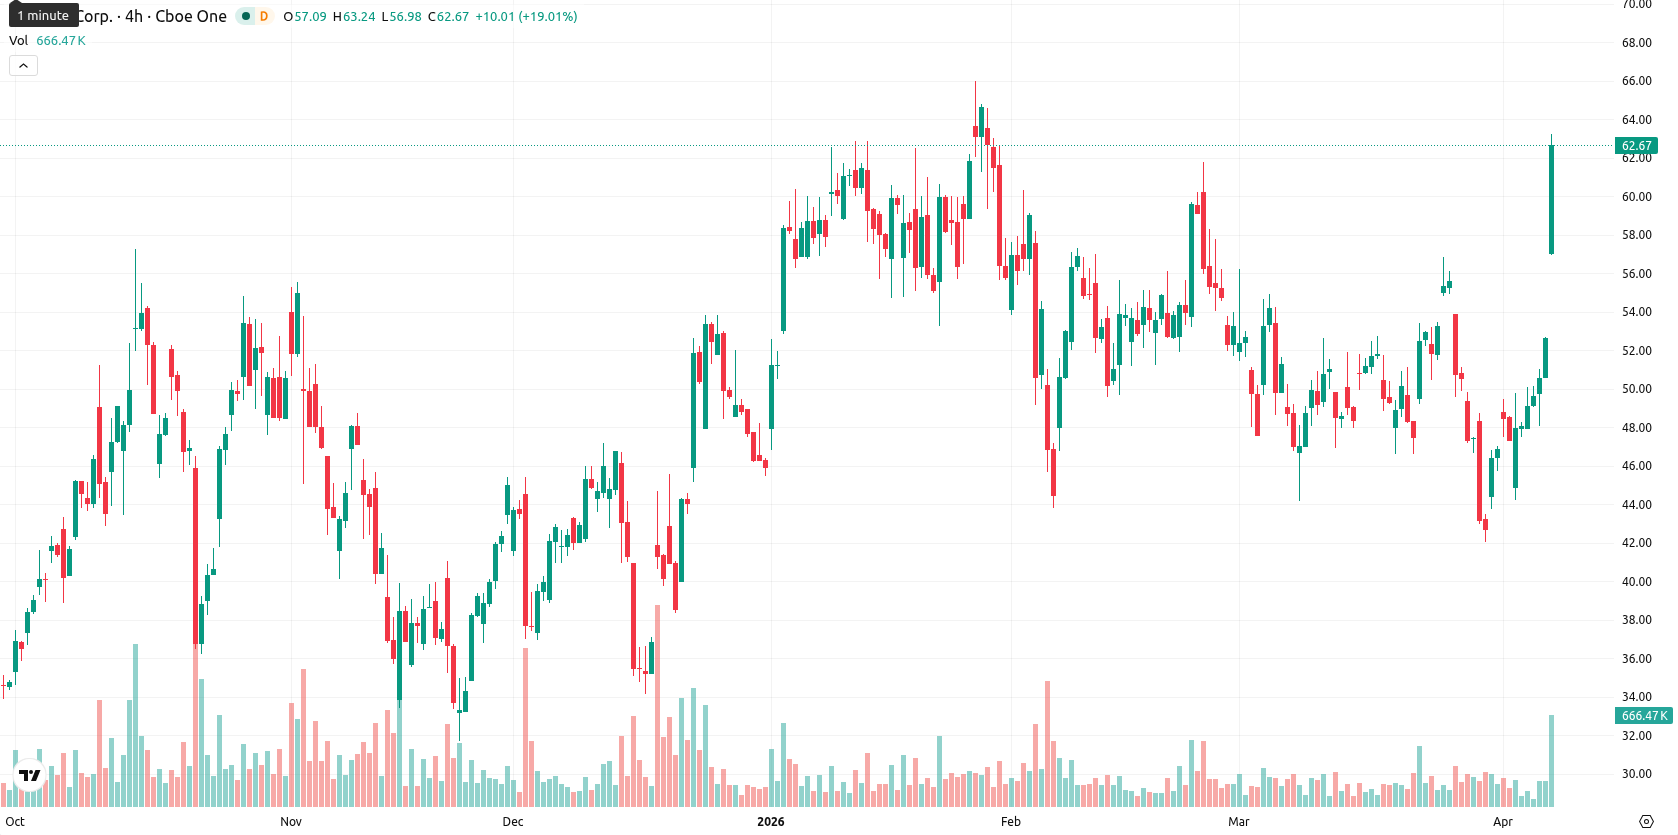
Hut 8 Corp (HUT) is trading at $62.31, posting a daily gain of 18.32%. The price sits well above its MA-20 ($49.71), MA-50 ($52.49), and MA-200 ($40.33), highlighting strong bullish momentum across all major timeframes.
Highlights
- HUT trades with strong bullish momentum, showing a steep rally and high volatility after a significant opening gap.
- Indicators are conflicted as price action remains elevated, with overbought signals and neutral momentum suggesting potential for consolidation.
- Key technical support is around $56.00, resistance near $68.00, with a forecasted price range between $56.00 and $68.00 over the next five sessions.
Mixed technical signals as price momentum diverges
Momentum signals are mixed: MACD D1 suggests strong selling while ADX reads as neutral, indicating a potentially weak or indecisive trend. Among oscillators, RSI and CCI show a buy bias, but Stoch RSI and BBP confirm overbought conditions, with BBP highlighting pronounced buyer dominance. The Awesome Oscillator remains neutral, not strongly confirming the current upward run, and these conflicting signals underscore a divergence between rising price action and indecisive momentum. The Ichimoku Kijun level on D1 is $49.47, now acting as immediate support, while today saw a significant opening gap higher and high intraday volatility, with current levels near session highs.
Upside favored as indicators align despite overbought risks
For the coming five trading days, and adjusting for recent volatility, the expected price range is $56.00 to $68.00. There is a very high probability (over 80%) of an upward movement, based on alignment across W1 indicators such as RSI, MA-50, and MACD, making a notable decline less likely. The baseline scenario is for price action to consolidate in a wide corridor after rapid gains. A bullish scenario could see an extension above $68.00 if momentum overcomes overbought signals, while a bearish scenario could develop if support near $56.00 fails, leading to a sharper pullback as overbought signals unwind.
Earlier, analysts noted that Hut 8 was demonstrating strong long-term technical support amid short-term volatility, with sustained buying pressure hinting at potential for further upside. The current surge and broad bullish momentum strengthen that outlook, but with overbought signals now present, traders should closely monitor whether HUT can extend above $68.00 or if a reversal develops from stretched conditions.


Latest Hut 8 News


-
 Afghanistan
-
 Albania
-
 Algeria
-
 Angola
-
 Argentina
-
 Armenia
-
 Australia
-
 Austria
-
 Azerbaijan
-
 Bahamas
-
 Bahrain
-
 Bangladesh
-
 Belarus
-
 Belgium
-
 Bolivia
-
 Botswana
-
 Brazil
-
 Brunei
-
 Bulgaria
-
 Cambodia
-
 Cameroon
-
 Canada
-
 Chile
Chile
-
 China
China
-
 Colombia
-
 Congo
Congo
-
 Costa Rica
-
 Cote d'Ivoire
-
 Croatia
-
 Cuba
Cuba
-
 Cyprus
-
 Czechia
-
 DR Congo
-
 Denmark
-
 Dominican Republic
-
 Ecuador
-
 Egypt
Egypt
-
 El Salvador
-
 Estonia
-
 Eswatini
-
 Ethiopia
-
 Finland
-
 France
-
 Georgia
-
 Germany
-
 Ghana
Ghana
-
 Greece
-
 Haiti
Haiti
-
 Hong Kong
-
 Hungary
-
 India
India
-
 Indonesia
-
 Iran, Islamic republic
-
 Iraq
Iraq
-
 Ireland
-
 Israel
-
 Italy
Italy
-
 Jamaica
-
 Japan
Japan
-
 Jordan
-
 Kazakhstan
-
 Kenya
Kenya
-
 Korea
Korea
-
 Kuwait
-
 Kyrgyzstan
-
 Laos
Laos
-
 Latvia
-
 Lebanon
-
 Lesotho
-
 Libya
Libya
-
 Lithuania
-
 Luxembourg
-
 Madagascar
-
 Malaysia
-
 Malta
Malta
-
 Mauritius
-
 Mexico
-
 Moldova
-
 Mongolia
-
 Montenegro
-
 Morocco
-
 Mozambique
-
 Myanmar
-
 Namibia
-
 Nepal
Nepal
-
 Netherlands
-
 New Zealand
-
 Nigeria
-
 North Macedonia
-
 Norway
-
 Oman
Oman
-
 Pakistan
-
 Palestine
-
 Panama
-
 Papua New Guinea
-
 Paraguay
-
 Peru
Peru
-
 Philippines
-
 Poland
-
 Portugal
-
 Puerto Rico
-
 Qatar
Qatar
-
 Reunion
-
 Romania
-
 Rwanda
-
 Saudi Arabia
-
 Serbia
-
 Singapore
-
 Slovakia
-
 Slovenia
-
 Somalia
-
 South Africa
-
 Spain
Spain
-
 Sri Lanka
-
 Sweden
-
 Switzerland
-
 Syria
Syria
-
 Taiwan
-
 Tajikistan
-
 Tanzania
-
 Thailand
-
 Trinidad and Tobago
-
 Tunisia
-
 Turkey
-
 UAE
UAE
-
 Uganda
-
 Ukraine
-
 United Kingdom
-
United States
-
 Uruguay
-
 Uzbekistan
-
 Venezuela
-
 Vietnam
-
 Yemen
Yemen
-
 Zambia
-
 Zimbabwe
- Forex
- Crypto
