
Canopy Growth stock slips as sellers weigh on price near session lows

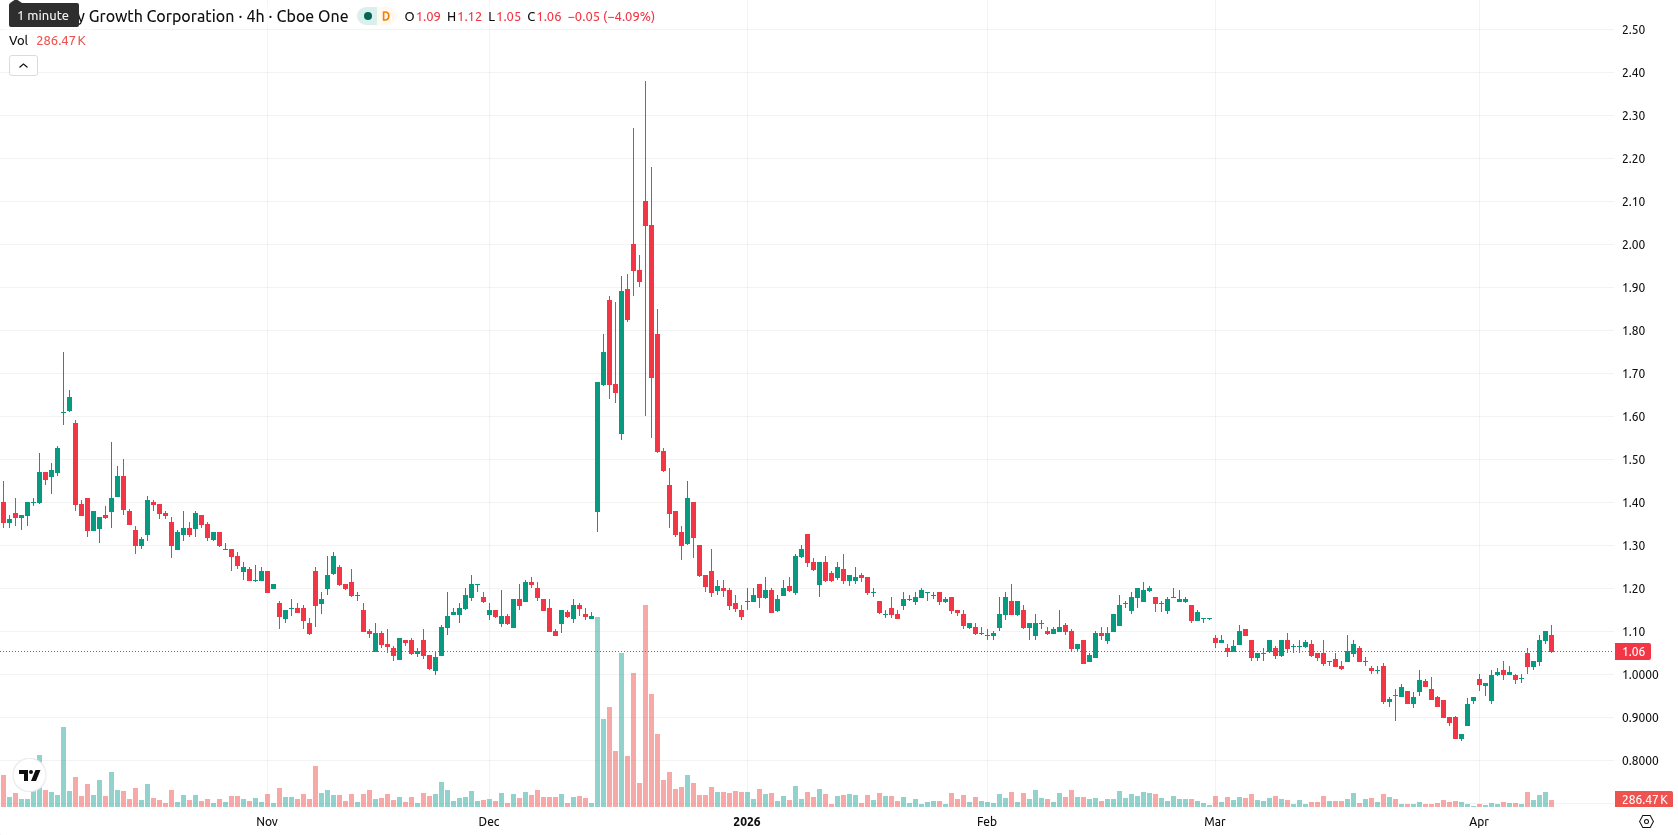
Canopy Growth Corporation (CGC) is trading at $1.06, down 3.19% on the day. The price sits right at the MA-50 ($1.06), above the MA-20 ($0.99), but remains well below the MA-200 ($1.22), highlighting near-term momentum but persistent long-term resistance.
Highlights
- Canopy Growth is showing sideways price action, with the current price consolidating near the 50-day moving average.
- Technical indicators reflect mixed momentum signals, with short-term upside exhaustion alongside a bearish medium-term bias.
- Anticipated trading range is $1.04 to $1.10 this week, with downside risk dominating and limited likelihood of a breakout higher.
Mixed momentum as oscillators diverge amid persistent seller pressure
The current price of Canopy Growth ($1.06) trades just at the MA-50 ($1.06), above the MA-20 ($0.99), and well below the MA-200 ($1.22). This positioning suggests short-term and medium-term momentum is positive, but significant longer-term resistance persists; the Ichimoku Kijun at $0.98 sits below the market, acting as immediate support. Momentum signals are mixed: while MACD (strong sell) and ADX (neutral, weak trend) show waning strength, RSI (58.43, buy) and CCI (120.16, overbought) point to some upside exhaustion, echoed by an overbought Stoch RSI. BBP (0.10, buy) highlights mild buyer dominance intraday, although this does not seem aggressive. AO is neutral, and daily price action confirms weakness — falling 3.19% from the open without a material gap, settling near the session low ($1.06) in the day's range ($1.06 — $1.12). Volatility appears moderate, with tone negative after the open and a tilt toward seller pressure. Notably, momentum and oscillators diverge, as upside indicators conflict with MACD's bearish bias and the day’s market drop.
Downside risk dominates as trend signals cap breakout potential
For the short term, the expected weekly range is $1.04 — $1.10, adjusted to fit a typical volatility band relative to current levels. The probability of an upward move is very low (less than 20%), making downside more likely given persistent weekly pressure from all major trend indicators. The base scenario is further sideways trading within the indicated range. A bullish break above $1.10 could challenge higher resistances if volume returns, while a bearish move below $1.04 would open the door to new lows as longer-term sellers remain in control.
Earlier, analysts noted that Canopy Growth remained under persistent bearish momentum despite occasional short-term buyer strength. The current setup, with downside pressure intensifying and mixed signals across momentum indicators, reinforces a cautious outlook—traders should closely monitor $1.04 as the next pivotal level for potential downside acceleration.


Latest Canopy Growth News


-
 Afghanistan
-
 Albania
-
 Algeria
-
 Angola
-
 Argentina
-
 Armenia
-
 Australia
-
 Austria
-
 Azerbaijan
-
 Bahamas
-
 Bahrain
-
 Bangladesh
-
 Belarus
-
 Belgium
-
 Bolivia
-
 Botswana
-
 Brazil
-
 Brunei
-
 Bulgaria
-
 Cambodia
-
 Cameroon
-
 Canada
-
 Chile
Chile
-
 China
China
-
 Colombia
-
 Congo
Congo
-
 Costa Rica
-
 Cote d'Ivoire
-
 Croatia
-
 Cuba
Cuba
-
 Cyprus
-
 Czechia
-
 DR Congo
-
 Denmark
-
 Dominican Republic
-
 Ecuador
-
 Egypt
Egypt
-
 El Salvador
-
 Estonia
-
 Eswatini
-
 Ethiopia
-
 Finland
-
 France
-
 Georgia
-
 Germany
-
 Ghana
Ghana
-
 Greece
-
 Haiti
Haiti
-
 Hong Kong
-
 Hungary
-
 India
India
-
 Indonesia
-
 Iran, Islamic republic
-
 Iraq
Iraq
-
 Ireland
-
 Israel
-
 Italy
Italy
-
 Jamaica
-
 Japan
Japan
-
 Jordan
-
 Kazakhstan
-
 Kenya
Kenya
-
 Korea
Korea
-
 Kuwait
-
 Kyrgyzstan
-
 Laos
Laos
-
 Latvia
-
 Lebanon
-
 Lesotho
-
 Libya
Libya
-
 Lithuania
-
 Luxembourg
-
 Madagascar
-
 Malaysia
-
 Malta
Malta
-
 Mauritius
-
 Mexico
-
 Moldova
-
 Mongolia
-
 Montenegro
-
 Morocco
-
 Mozambique
-
 Myanmar
-
 Namibia
-
 Nepal
Nepal
-
 Netherlands
-
 New Zealand
-
 Nigeria
-
 North Macedonia
-
 Norway
-
 Oman
Oman
-
 Pakistan
-
 Palestine
-
 Panama
-
 Papua New Guinea
-
 Paraguay
-
 Peru
Peru
-
 Philippines
-
 Poland
-
 Portugal
-
 Puerto Rico
-
 Qatar
Qatar
-
 Reunion
-
 Romania
-
 Rwanda
-
 Saudi Arabia
-
 Serbia
-
 Singapore
-
 Slovakia
-
 Slovenia
-
 Somalia
-
 South Africa
-
 Spain
Spain
-
 Sri Lanka
-
 Sweden
-
 Switzerland
-
 Syria
Syria
-
 Taiwan
-
 Tajikistan
-
 Tanzania
-
 Thailand
-
 Trinidad and Tobago
-
 Tunisia
-
 Turkey
-
 UAE
UAE
-
 Uganda
-
 Ukraine
-
 United Kingdom
-
United States
-
 Uruguay
-
 Uzbekistan
-
 Venezuela
-
 Vietnam
-
 Yemen
Yemen
-
 Zambia
-
 Zimbabwe
- Forex
- Crypto
