
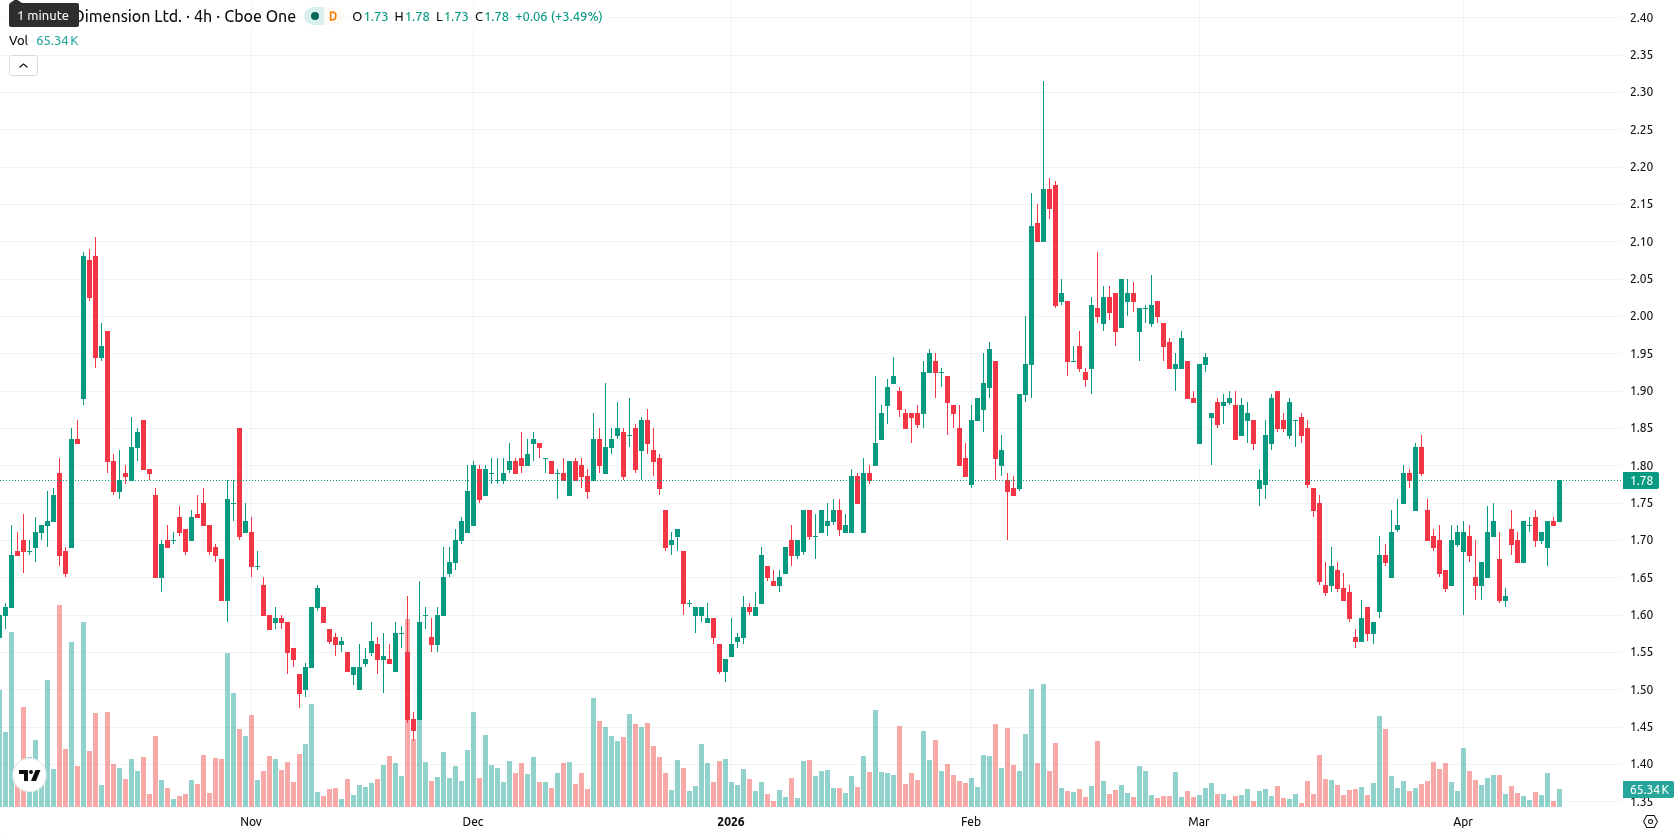
Nano Dimension stock price forecast: $1.82 resistance in focus as NNDM rises 3.49%

Nano Dimension Ltd (NNDM) is trading at $1.78, above both the MA-20 ($1.68) and the MA-200 ($1.66), but just below the MA-50 ($1.82). This setup points to short-term bullish momentum supported by the long-term trend, while medium-term resistance remains close.
Highlights
- NNDM shows short-term bullish momentum but faces medium-term resistance, with support from a firm long-term trend.
- Technical indicators conflict, as intraday price strength is undercut by persistent bearish momentum and signals of potential short-term exhaustion.
- For the next five sessions, NNDM is expected to consolidate between $1.61 and $1.95, with a downside bias favored over a breakout.
Mixed momentum as price strength diverges from technical signals
The Ichimoku Kijun level at $1.73 sits below the current price, acting as immediate support. MACD on the daily chart signals strong bearish momentum and the daily ADX is neutral, suggesting a trendless market phase. RSI is slightly under the midpoint at 49.14 and CCI remains neutral, while Stoch RSI is in the overbought zone, hinting at possible short-term exhaustion. Bull/Bear Power (BBP) indicates buyers dominate intraday action, even as momentum signals are mixed and the Awesome Oscillator stays neutral, highlighting a divergence between price strength and technical confirmation.
Downside risk dominates as upside breakout requires key close
Over the next five trading sessions, NNDM is expected to trade within a $1.61 to $1.95 range, reflecting typical volatility relative to current levels. The probability of a price rise is low (less than 20%), so a downward move is more likely. The baseline expectation is for the price to consolidate sideways within this band. For a bullish breakout, the price must close above $1.82, while a drop below the $1.73 – $1.66 support area would open the way for a deeper retracement.
Previously it was reported that Nano Dimension faced persistent bearish momentum and operational headwinds, leading analysts to maintain a cautious outlook. This updated analysis confirms continued uncertainty as bullish price action remains unsupported by momentum indicators, making the $1.73–$1.66 zone a crucial area to monitor for potential downside acceleration.


Latest Nano Dimension News


-
 Afghanistan
-
 Albania
-
 Algeria
-
 Angola
-
 Argentina
-
 Armenia
-
 Australia
-
 Austria
-
 Azerbaijan
-
 Bahamas
-
 Bahrain
-
 Bangladesh
-
 Belarus
-
 Belgium
-
 Bolivia
-
 Botswana
-
 Brazil
-
 Brunei
-
 Bulgaria
-
 Cambodia
-
 Cameroon
-
 Canada
-
 Chile
Chile
-
 China
China
-
 Colombia
-
 Congo
Congo
-
 Costa Rica
-
 Cote d'Ivoire
-
 Croatia
-
 Cuba
Cuba
-
 Cyprus
-
 Czechia
-
 DR Congo
-
 Denmark
-
 Dominican Republic
-
 Ecuador
-
 Egypt
Egypt
-
 El Salvador
-
 Estonia
-
 Eswatini
-
 Ethiopia
-
 Finland
-
 France
-
 Georgia
-
 Germany
-
 Ghana
Ghana
-
 Greece
-
 Haiti
Haiti
-
 Hong Kong
-
 Hungary
-
 India
India
-
 Indonesia
-
 Iran, Islamic republic
-
 Iraq
Iraq
-
 Ireland
-
 Israel
-
 Italy
Italy
-
 Jamaica
-
 Japan
Japan
-
 Jordan
-
 Kazakhstan
-
 Kenya
Kenya
-
 Korea
Korea
-
 Kuwait
-
 Kyrgyzstan
-
 Laos
Laos
-
 Latvia
-
 Lebanon
-
 Lesotho
-
 Libya
Libya
-
 Lithuania
-
 Luxembourg
-
 Madagascar
-
 Malaysia
-
 Malta
Malta
-
 Mauritius
-
 Mexico
-
 Moldova
-
 Mongolia
-
 Montenegro
-
 Morocco
-
 Mozambique
-
 Myanmar
-
 Namibia
-
 Nepal
Nepal
-
 Netherlands
-
 New Zealand
-
 Nigeria
-
 North Macedonia
-
 Norway
-
 Oman
Oman
-
 Pakistan
-
 Palestine
-
 Panama
-
 Papua New Guinea
-
 Paraguay
-
 Peru
Peru
-
 Philippines
-
 Poland
-
 Portugal
-
 Puerto Rico
-
 Qatar
Qatar
-
 Reunion
-
 Romania
-
 Rwanda
-
 Saudi Arabia
-
 Serbia
-
 Singapore
-
 Slovakia
-
 Slovenia
-
 Somalia
-
 South Africa
-
 Spain
Spain
-
 Sri Lanka
-
 Sweden
-
 Switzerland
-
 Syria
Syria
-
 Taiwan
-
 Tajikistan
-
 Tanzania
-
 Thailand
-
 Trinidad and Tobago
-
 Tunisia
-
 Turkey
-
 UAE
UAE
-
 Uganda
-
 Ukraine
-
 United Kingdom
-
United States
-
 Uruguay
-
 Uzbekistan
-
 Venezuela
-
 Vietnam
-
 Yemen
Yemen
-
 Zambia
-
 Zimbabwe
- Forex
- Crypto
