
PEP stock consolidates near $156 as price holds above MA-20 and MA-50: weekly outlook

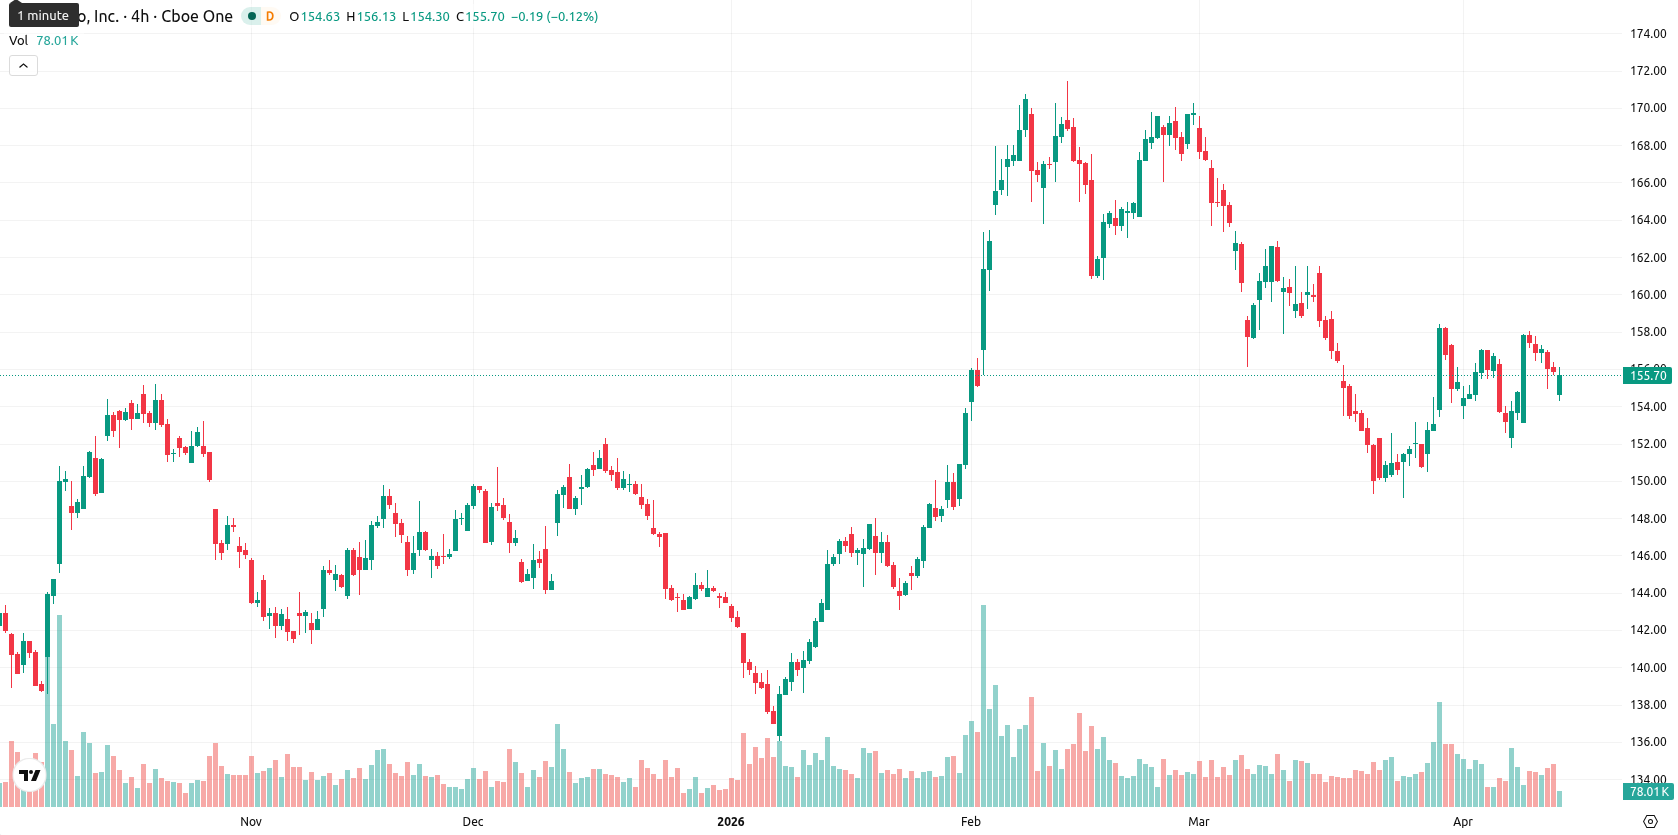
PepsiCo, Inc. (PEP) is currently trading at $155.66, which positions it above the weekly MA-20 at $153.89 and the MA-50 at $146.23, but still below the MA-200 at $164.22. Over the past week, PEP declined by $1.37 (0.83%), moving within a range of $151.75 to $158.01 and maintaining a medium-term bullish posture while facing longer-term resistance.
Highlights
- PepsiCo is trading above short- and medium-term averages, signaling a medium-term bullish bias but facing long-term resistance.
- Technical momentum indicators are mixed, with some suggesting recovery potential while others highlight weak trend strength and persistent buyer pressure.
- Next week's expected trading range is $149.25 to $162.06, with sideways movement likely and a 50/50 probability of breakout in either direction.
Margin pressures and activist actions drive cautious sentiment this week
PepsiCo announced price reductions of up to 15% on core snack brands in response to consumer backlash. The company continues to experience margin pressures from tariffs and rising input costs, causing softness in North American performance. PepsiCo also faces pressure from activist investor Elliott Management, which has taken a $4 billion stake and is seeking operational changes. Institutional activity saw Robeco Institutional Asset Management increasing its holdings, while the State of Alaska Department of Revenue reduced its stake in the company.
Momentum divergence persists as indicators highlight mixed weekly signals
On the weekly (W1) chart, PEP trades above both the MA-20 and MA-50 but remains under the MA-200, supporting a medium-term bullish trend amid longer-term resistance. Weekly momentum indicators show mixed signals: the MACD indicates a Strong Buy with mild upside potential, the ADX is Neutral, RSI is at 52.48 (Buy), Stochastic RSI shows oversold conditions suggesting recovery potential, while Bull/Bear Power flags an overbought market. Current volatility is 4.13%, and the price stayed in the upper segment of its weekly range, reflecting a moderate pullback and ongoing divergence in oscillators.
Balanced bullish and bearish risks as technical split points to range trade
For the next 5 trading days, PEP is expected to fluctuate between $149.25 and $162.06. With weekly technical indicators divided—half signaling Buy—the odds for upside or downside are nearly balanced, making sideways movement the baseline scenario. A bullish move could target a breakout above $162.06 and further rebound, while a bearish shift may push the price below $149.25 toward the nearest support.
In a recent review, analysts highlighted that PepsiCo was experiencing mixed market signals and was likely to remain rangebound barring a strong catalyst. With new operational pressures and activist investor involvement emerging, traders should closely monitor price action near the $162.06 resistance, as a breakout here could indicate a shift from consolidation to renewed upside momentum.


-
 Afghanistan
-
 Albania
-
 Algeria
-
 Angola
-
 Argentina
-
 Armenia
-
 Australia
-
 Austria
-
 Azerbaijan
-
 Bahamas
-
 Bahrain
-
 Bangladesh
-
 Belarus
-
 Belgium
-
 Bolivia
-
 Botswana
-
 Brazil
-
 Brunei
-
 Bulgaria
-
 Cambodia
-
 Cameroon
-
 Canada
-
 Chile
Chile
-
 China
China
-
 Colombia
-
 Congo
Congo
-
 Costa Rica
-
 Cote d'Ivoire
-
 Croatia
-
 Cuba
Cuba
-
 Cyprus
-
 Czechia
-
 DR Congo
-
 Denmark
-
 Dominican Republic
-
 Ecuador
-
 Egypt
Egypt
-
 El Salvador
-
 Estonia
-
 Eswatini
-
 Ethiopia
-
 Finland
-
 France
-
 Georgia
-
 Germany
-
 Ghana
Ghana
-
 Greece
-
 Haiti
Haiti
-
 Hong Kong
-
 Hungary
-
 India
India
-
 Indonesia
-
 Iran, Islamic republic
-
 Iraq
Iraq
-
 Ireland
-
 Israel
-
 Italy
Italy
-
 Jamaica
-
 Japan
Japan
-
 Jordan
-
 Kazakhstan
-
 Kenya
Kenya
-
 Korea
Korea
-
 Kuwait
-
 Kyrgyzstan
-
 Laos
Laos
-
 Latvia
-
 Lebanon
-
 Lesotho
-
 Libya
Libya
-
 Lithuania
-
 Luxembourg
-
 Madagascar
-
 Malaysia
-
 Malta
Malta
-
 Mauritius
-
 Mexico
-
 Moldova
-
 Mongolia
-
 Montenegro
-
 Morocco
-
 Mozambique
-
 Myanmar
-
 Namibia
-
 Nepal
Nepal
-
 Netherlands
-
 New Zealand
-
 Nigeria
-
 North Macedonia
-
 Norway
-
 Oman
Oman
-
 Pakistan
-
 Palestine
-
 Panama
-
 Papua New Guinea
-
 Paraguay
-
 Peru
Peru
-
 Philippines
-
 Poland
-
 Portugal
-
 Puerto Rico
-
 Qatar
Qatar
-
 Reunion
-
 Romania
-
 Rwanda
-
 Saudi Arabia
-
 Serbia
-
 Singapore
-
 Slovakia
-
 Slovenia
-
 Somalia
-
 South Africa
-
 Spain
Spain
-
 Sri Lanka
-
 Sweden
-
 Switzerland
-
 Syria
Syria
-
 Taiwan
-
 Tajikistan
-
 Tanzania
-
 Thailand
-
 Trinidad and Tobago
-
 Tunisia
-
 Turkey
-
 UAE
UAE
-
 Uganda
-
 Ukraine
-
 United Kingdom
-
United States
-
 Uruguay
-
 Uzbekistan
-
 Venezuela
-
 Vietnam
-
 Yemen
Yemen
-
 Zambia
-
 Zimbabwe
- Forex
- Crypto
