
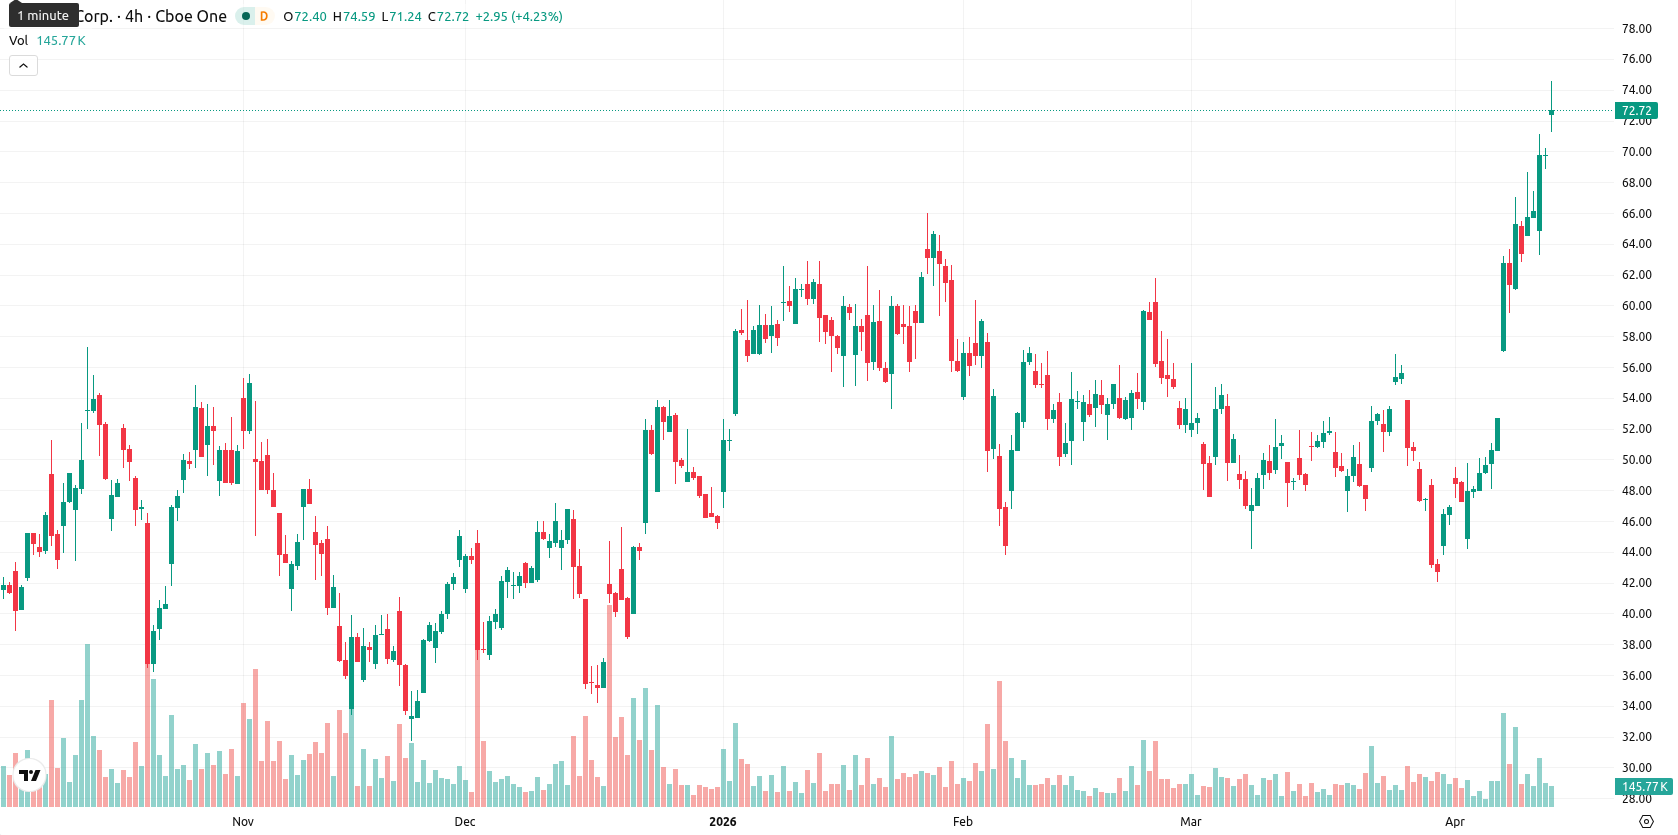
Hut 8 stock climbs 4.26% as price breaks above all major trend averages

Hut 8 Corp (HUT) is trading at $72.73, up 4.26% on the day and remains well above its key moving averages: SMA-20 ($52.89), SMA-50 ($52.82), and SMA-200 ($41.30), confirming a strong bullish structure across all observed timeframes.
Highlights
- HUT maintains a strong bullish trend, consistently trading above key short-, medium-, and long-term moving averages.
- Technical indicators signal overbought conditions and buyer dominance, suggesting continued upside but elevated risk of short-term pullbacks.
- HUT is expected to consolidate within the $69.00–$77.00 range over the next five sessions, with over 80% probability of further gains.
Bullish momentum persists as overbought risk intensifies
Momentum signals remain bullish for HUT, with the D1 MACD showing a buy indication while the ADX at 11.64 suggests the current trend's strength is still limited. Oscillators present clear overbought conditions: the RSI stands at 70.45, Stoch RSI at 100.00, and CCI at 200.61. Bull/Bear Power (BBP) confirms persistent buyer dominance even as overbought signals prevail above 14. The Ichimoku Kijun at $56.61 now acts as immediate support, and intraday price action is holding near the upper end of the $71.21 – $74.43 session range with significant volatility and robust buying momentum, indicating early session strength but also possible near-term overheating.
Further gains likely as bullish signals drive near-term range
Over the next five trading days, HUT is expected to fluctuate within a typical volatility band of $69.00 – $77.00. The probability of further upside is very high (greater than 80%) given the consistent bullish weekly signals from the MA-50, RSI, ADX, and MACD. The baseline case sees price consolidation within this corridor. In a bullish scenario, a break above $77.00 is possible if overbought conditions resolve with continued buying momentum, while a move below $69.00 would likely require buyer capitulation and clear signals of a reversal.
Earlier, analysts noted that Hut 8 was exhibiting strong bullish momentum supported by favorable technical indicators. The latest data reinforces this outlook and suggests that traders should now monitor the $77.00 threshold closely, as a decisive move above this level could signal the start of another upward leg.


Latest Hut 8 News


-
 Afghanistan
-
 Albania
-
 Algeria
-
 Angola
-
 Argentina
-
 Armenia
-
 Australia
-
 Austria
-
 Azerbaijan
-
 Bahamas
-
 Bahrain
-
 Bangladesh
-
 Belarus
-
 Belgium
-
 Bolivia
-
 Botswana
-
 Brazil
-
 Brunei
-
 Bulgaria
-
 Cambodia
-
 Cameroon
-
 Canada
-
 Chile
Chile
-
 China
China
-
 Colombia
-
 Congo
Congo
-
 Costa Rica
-
 Cote d'Ivoire
-
 Croatia
-
 Cuba
Cuba
-
 Cyprus
-
 Czechia
-
 DR Congo
-
 Denmark
-
 Dominican Republic
-
 Ecuador
-
 Egypt
Egypt
-
 El Salvador
-
 Estonia
-
 Eswatini
-
 Ethiopia
-
 Finland
-
 France
-
 Georgia
-
 Germany
-
 Ghana
Ghana
-
 Greece
-
 Haiti
Haiti
-
 Hong Kong
-
 Hungary
-
 India
India
-
 Indonesia
-
 Iran, Islamic republic
-
 Iraq
Iraq
-
 Ireland
-
 Israel
-
 Italy
Italy
-
 Jamaica
-
 Japan
Japan
-
 Jordan
-
 Kazakhstan
-
 Kenya
Kenya
-
 Korea
Korea
-
 Kuwait
-
 Kyrgyzstan
-
 Laos
Laos
-
 Latvia
-
 Lebanon
-
 Lesotho
-
 Libya
Libya
-
 Lithuania
-
 Luxembourg
-
 Madagascar
-
 Malaysia
-
 Malta
Malta
-
 Mauritius
-
 Mexico
-
 Moldova
-
 Mongolia
-
 Montenegro
-
 Morocco
-
 Mozambique
-
 Myanmar
-
 Namibia
-
 Nepal
Nepal
-
 Netherlands
-
 New Zealand
-
 Nigeria
-
 North Macedonia
-
 Norway
-
 Oman
Oman
-
 Pakistan
-
 Palestine
-
 Panama
-
 Papua New Guinea
-
 Paraguay
-
 Peru
Peru
-
 Philippines
-
 Poland
-
 Portugal
-
 Puerto Rico
-
 Qatar
Qatar
-
 Reunion
-
 Romania
-
 Rwanda
-
 Saudi Arabia
-
 Serbia
-
 Singapore
-
 Slovakia
-
 Slovenia
-
 Somalia
-
 South Africa
-
 Spain
Spain
-
 Sri Lanka
-
 Sweden
-
 Switzerland
-
 Syria
Syria
-
 Taiwan
-
 Tajikistan
-
 Tanzania
-
 Thailand
-
 Trinidad and Tobago
-
 Tunisia
-
 Turkey
-
 UAE
UAE
-
 Uganda
-
 Ukraine
-
 United Kingdom
-
United States
-
 Uruguay
-
 Uzbekistan
-
 Venezuela
-
 Vietnam
-
 Yemen
Yemen
-
 Zambia
-
 Zimbabwe
- Forex
- Crypto
