
Intuit stock gains 6.09% as revenue growth driven by QuickBooks Online Advanced

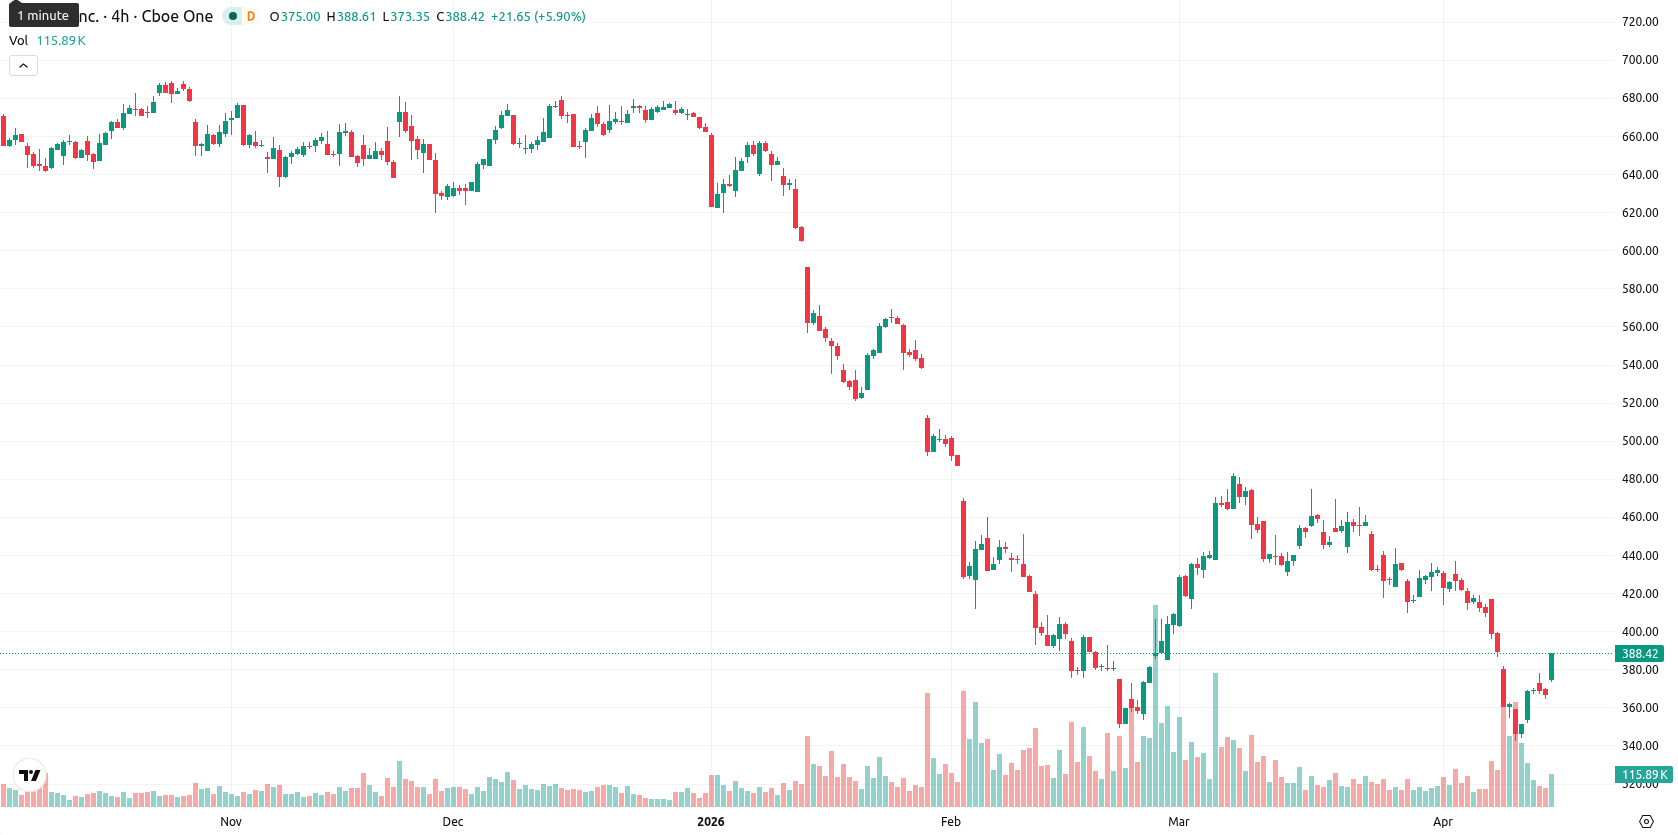
Intuit Inc. (INTU) is trading at $389.34, reflecting a daily gain of 6.09%. The current price is positioned below the MA-20 ($417.93), MA-50 ($420.58), and MA-200 ($613.00), highlighting sustained seller pressure across all major timeframes.
Highlights
- Intuit posted Q2 FY26 revenue of $4.7 billion, up 17% year over year, led by strong QuickBooks suite growth.
- Accelerated AI integration, including Intuit Assist for automation, is enhancing competitive advantages in bookkeeping and analytics.
- Shares trade below major moving averages amid persistent bearish momentum, with price expected to range between $375.00 and $395.00 short term.
Revenue growth as AI rollout and core products drive sentiment
Intuit reported $4.7 billion in revenue for its Q2 FY26 (ended January 2026), up 17% year over year, driven by robust growth in QuickBooks Online Advanced and Enterprise Suite. The company is advancing its AI integration with tools like Intuit Assist automating bookkeeping and analytics tasks. TurboTax and QuickBooks Online continue to hold strong market positions among small businesses and individual consumers.
Oversold momentum as bearish signals clash with intraday strength
Technical momentum remains weak on the daily chart, with the price below all major moving averages. Key resistance sits at the Ichimoku Kijun on D1 ($411.73), while MACD (-27.88), ADX (28.17), and the Awesome Oscillator all confirm ongoing bearish direction. Oscillators including RSI (33.51), CCI (-127.22), and BBP (-17.45) indicate oversold conditions and continued seller dominance, though the Stoch RSI is neutral. Today's session opened with a gap up from $367.00 to $376.28, and the last trade is near the daily high ($387.54), reflecting strong intraday momentum despite a broader bearish backdrop and volatility.
Downside risk dominates as breakout odds remain low
For the next five trading days, the anticipated price range for INTU is $375.00 to $395.00, consistent with typical volatility band relative to current levels. The probability of a near-term upward breakout remains very low (less than 20%), suggesting a greater likelihood of further declines or consolidation. A sustained move above $411.73 resistance would be required to signal bullish reversal, while continued selling below $375.00 could deepen short-term weakness.
Earlier, analysts noted that Intuit was under sustained downside pressure, with technical indicators supporting a prevailing bearish outlook across all timeframes. The current rebound in price amid ongoing oversold conditions suggests heightened volatility persists, making the $411.73 resistance level a critical threshold for any potential shift toward bullish momentum in the days ahead.


-
 Afghanistan
-
 Albania
-
 Algeria
-
 Angola
-
 Argentina
-
 Armenia
-
 Australia
-
 Austria
-
 Azerbaijan
-
 Bahamas
-
 Bahrain
-
 Bangladesh
-
 Belarus
-
 Belgium
-
 Bolivia
-
 Botswana
-
 Brazil
-
 Brunei
-
 Bulgaria
-
 Cambodia
-
 Cameroon
-
 Canada
-
 Chile
Chile
-
 China
China
-
 Colombia
-
 Congo
Congo
-
 Costa Rica
-
 Cote d'Ivoire
-
 Croatia
-
 Cuba
Cuba
-
 Cyprus
-
 Czechia
-
 DR Congo
-
 Denmark
-
 Dominican Republic
-
 Ecuador
-
 Egypt
Egypt
-
 El Salvador
-
 Estonia
-
 Eswatini
-
 Ethiopia
-
 Finland
-
 France
-
 Georgia
-
 Germany
-
 Ghana
Ghana
-
 Greece
-
 Haiti
Haiti
-
 Hong Kong
-
 Hungary
-
 India
India
-
 Indonesia
-
 Iran, Islamic republic
-
 Iraq
Iraq
-
 Ireland
-
 Israel
-
 Italy
Italy
-
 Jamaica
-
 Japan
Japan
-
 Jordan
-
 Kazakhstan
-
 Kenya
Kenya
-
 Korea
Korea
-
 Kuwait
-
 Kyrgyzstan
-
 Laos
Laos
-
 Latvia
-
 Lebanon
-
 Lesotho
-
 Libya
Libya
-
 Lithuania
-
 Luxembourg
-
 Madagascar
-
 Malaysia
-
 Malta
Malta
-
 Mauritius
-
 Mexico
-
 Moldova
-
 Mongolia
-
 Montenegro
-
 Morocco
-
 Mozambique
-
 Myanmar
-
 Namibia
-
 Nepal
Nepal
-
 Netherlands
-
 New Zealand
-
 Nigeria
-
 North Macedonia
-
 Norway
-
 Oman
Oman
-
 Pakistan
-
 Palestine
-
 Panama
-
 Papua New Guinea
-
 Paraguay
-
 Peru
Peru
-
 Philippines
-
 Poland
-
 Portugal
-
 Puerto Rico
-
 Qatar
Qatar
-
 Reunion
-
 Romania
-
 Rwanda
-
 Saudi Arabia
-
 Serbia
-
 Singapore
-
 Slovakia
-
 Slovenia
-
 Somalia
-
 South Africa
-
 Spain
Spain
-
 Sri Lanka
-
 Sweden
-
 Switzerland
-
 Syria
Syria
-
 Taiwan
-
 Tajikistan
-
 Tanzania
-
 Thailand
-
 Trinidad and Tobago
-
 Tunisia
-
 Turkey
-
 UAE
UAE
-
 Uganda
-
 Ukraine
-
 United Kingdom
-
United States
-
 Uruguay
-
 Uzbekistan
-
 Venezuela
-
 Vietnam
-
 Yemen
Yemen
-
 Zambia
-
 Zimbabwe
- Forex
- Crypto
