
+6.16% for Hut 8 stock as overbought signals warn of short-term downside risk

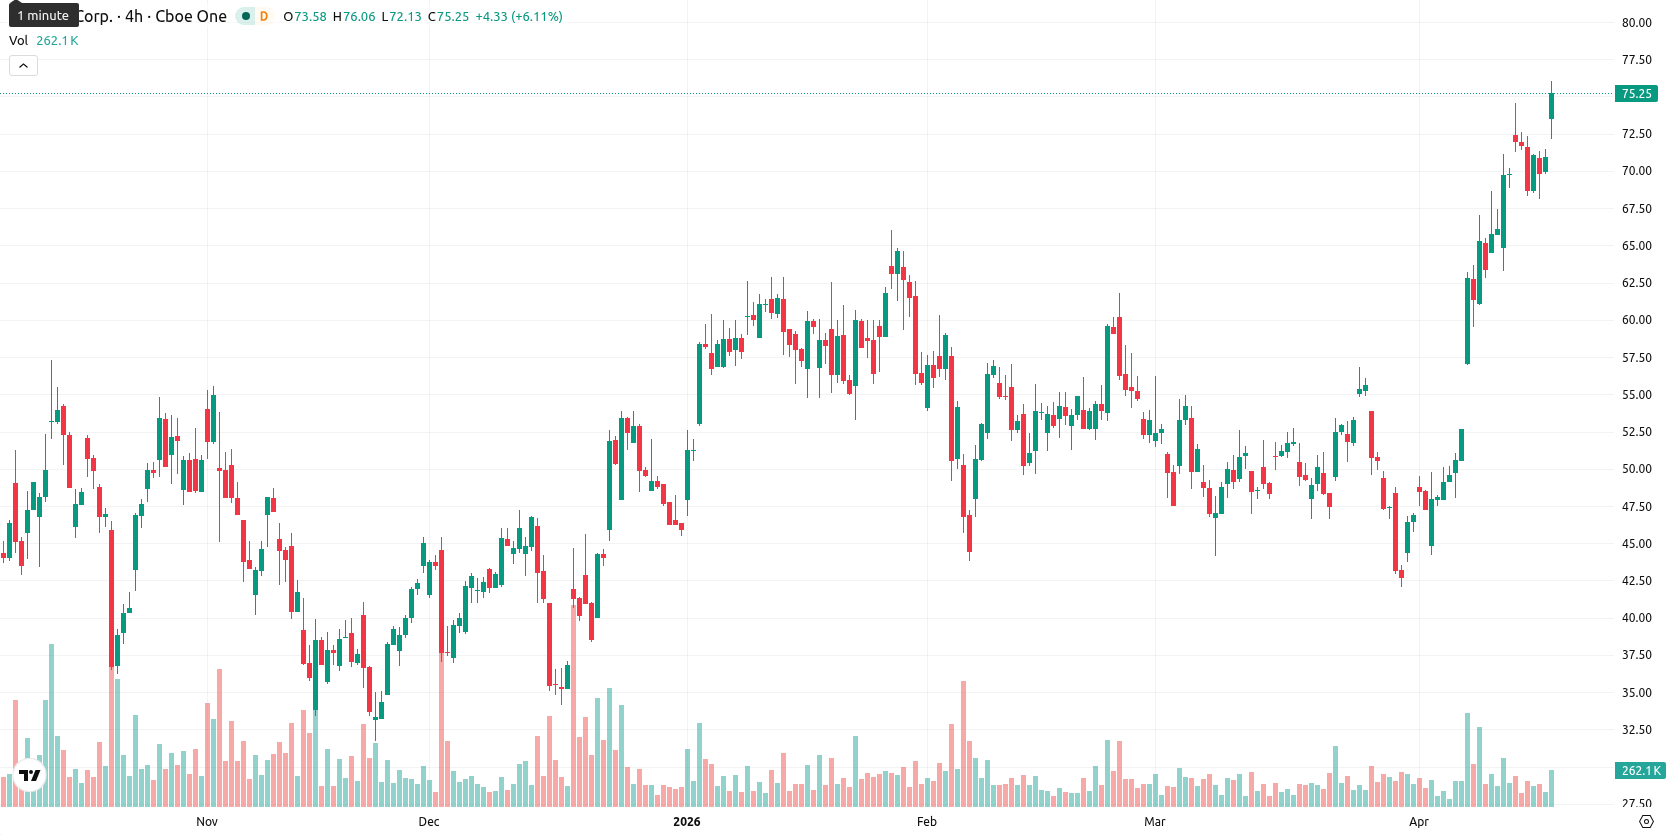
Hut 8 Corp (HUT) is trading at $75.29 after a strong daily gain of 6.16%. The current price is firmly above the SMA-20 ($55.96), SMA-50 ($53.68), and SMA-200 ($42.09), confirming bullish momentum across all key timeframes. The Ichimoku Kijun level at $58.36 is below the spot price and acts as immediate support.
Highlights
- The stock is in a strong bullish trend, trading significantly above all major moving averages across multiple timeframes.
- Momentum indicators are bullish but show overbought conditions and possible short-term exhaustion, suggesting high but unsustainable recent buying pressure.
- Projected five-day price action is likely to consolidate between $73.49 and $75.83, with an 80%+ probability of an upside breakout if resistance is surpassed.
Persistent upside momentum amid overbought signals and session gap
Momentum remains strong for HUT, with the MACD signaling Buy on both daily and weekly timeframes. ADX on the daily chart is neutral at 13.90, while it remains positive on the weekly, pointing to a developing but not yet robust trend. The RSI reads 70.33 (Buy), and both Stoch RSI (95.27) and CCI (117.40) are in overbought territory, which signals short-term exhaustion. Bull/Bear Power (BBP) is strongly positive at 9.22, highlighting clear buyer dominance. The Awesome Oscillator confirms upward movement. HUT opened the session with a notable upside gap from $70.92 to $73.11, and the price is currently near today’s high of $75.95. This reflects high volatility and persistent buying strength toward the upper end of the current trading range. The clustering of overbought oscillator values alongside continued momentum reveals a divergence to monitor, as intraday strength currently aligns with the bullish price action.
High breakout probability as consolidation sustains elevated price range
For the next five trading days, HUT is expected to trade within a volatility band between $73.49 and $75.83. The probability of a price increase remains very high (greater than 80%), while a decline is improbable. The baseline scenario suggests sideways consolidation above immediate support, keeping prices bound between $73.49 and $75.83. A clear breakout above $75.83 would likely trigger further gains, while a drop below $73.49 would signal a retracement toward the Ichimoku Kijun support level.
Previously it was reported that Hut 8 was exhibiting broad bullish momentum supported by favorable technical indicators, yet accompanied by overbought signals and heightened volatility. The current analysis not only confirms that positive trend but also highlights the increasing risk of short-term exhaustion, making a sustained breakout above $75.83 the key level for bulls to watch in the days ahead.


Latest Hut 8 News


-
 Afghanistan
-
 Albania
-
 Algeria
-
 Angola
-
 Argentina
-
 Armenia
-
 Australia
-
 Austria
-
 Azerbaijan
-
 Bahamas
-
 Bahrain
-
 Bangladesh
-
 Belarus
-
 Belgium
-
 Bolivia
-
 Botswana
-
 Brazil
-
 Brunei
-
 Bulgaria
-
 Cambodia
-
 Cameroon
-
 Canada
-
 Chile
Chile
-
 China
China
-
 Colombia
-
 Congo
Congo
-
 Costa Rica
-
 Cote d'Ivoire
-
 Croatia
-
 Cuba
Cuba
-
 Cyprus
-
 Czechia
-
 DR Congo
-
 Denmark
-
 Dominican Republic
-
 Ecuador
-
 Egypt
Egypt
-
 El Salvador
-
 Estonia
-
 Eswatini
-
 Ethiopia
-
 Finland
-
 France
-
 Georgia
-
 Germany
-
 Ghana
Ghana
-
 Greece
-
 Haiti
Haiti
-
 Hong Kong
-
 Hungary
-
 India
India
-
 Indonesia
-
 Iran, Islamic republic
-
 Iraq
Iraq
-
 Ireland
-
 Israel
-
 Italy
Italy
-
 Jamaica
-
 Japan
Japan
-
 Jordan
-
 Kazakhstan
-
 Kenya
Kenya
-
 Korea
Korea
-
 Kuwait
-
 Kyrgyzstan
-
 Laos
Laos
-
 Latvia
-
 Lebanon
-
 Lesotho
-
 Libya
Libya
-
 Lithuania
-
 Luxembourg
-
 Madagascar
-
 Malaysia
-
 Malta
Malta
-
 Mauritius
-
 Mexico
-
 Moldova
-
 Mongolia
-
 Montenegro
-
 Morocco
-
 Mozambique
-
 Myanmar
-
 Namibia
-
 Nepal
Nepal
-
 Netherlands
-
 New Zealand
-
 Nigeria
-
 North Macedonia
-
 Norway
-
 Oman
Oman
-
 Pakistan
-
 Palestine
-
 Panama
-
 Papua New Guinea
-
 Paraguay
-
 Peru
Peru
-
 Philippines
-
 Poland
-
 Portugal
-
 Puerto Rico
-
 Qatar
Qatar
-
 Reunion
-
 Romania
-
 Rwanda
-
 Saudi Arabia
-
 Serbia
-
 Singapore
-
 Slovakia
-
 Slovenia
-
 Somalia
-
 South Africa
-
 Spain
Spain
-
 Sri Lanka
-
 Sweden
-
 Switzerland
-
 Syria
Syria
-
 Taiwan
-
 Tajikistan
-
 Tanzania
-
 Thailand
-
 Trinidad and Tobago
-
 Tunisia
-
 Turkey
-
 UAE
UAE
-
 Uganda
-
 Ukraine
-
 United Kingdom
-
United States
-
 Uruguay
-
 Uzbekistan
-
 Venezuela
-
 Vietnam
-
 Yemen
Yemen
-
 Zambia
-
 Zimbabwe
- Forex
- Crypto
