
INTU stock gains 1.21% as price remains capped by major moving averages: weekly outlook

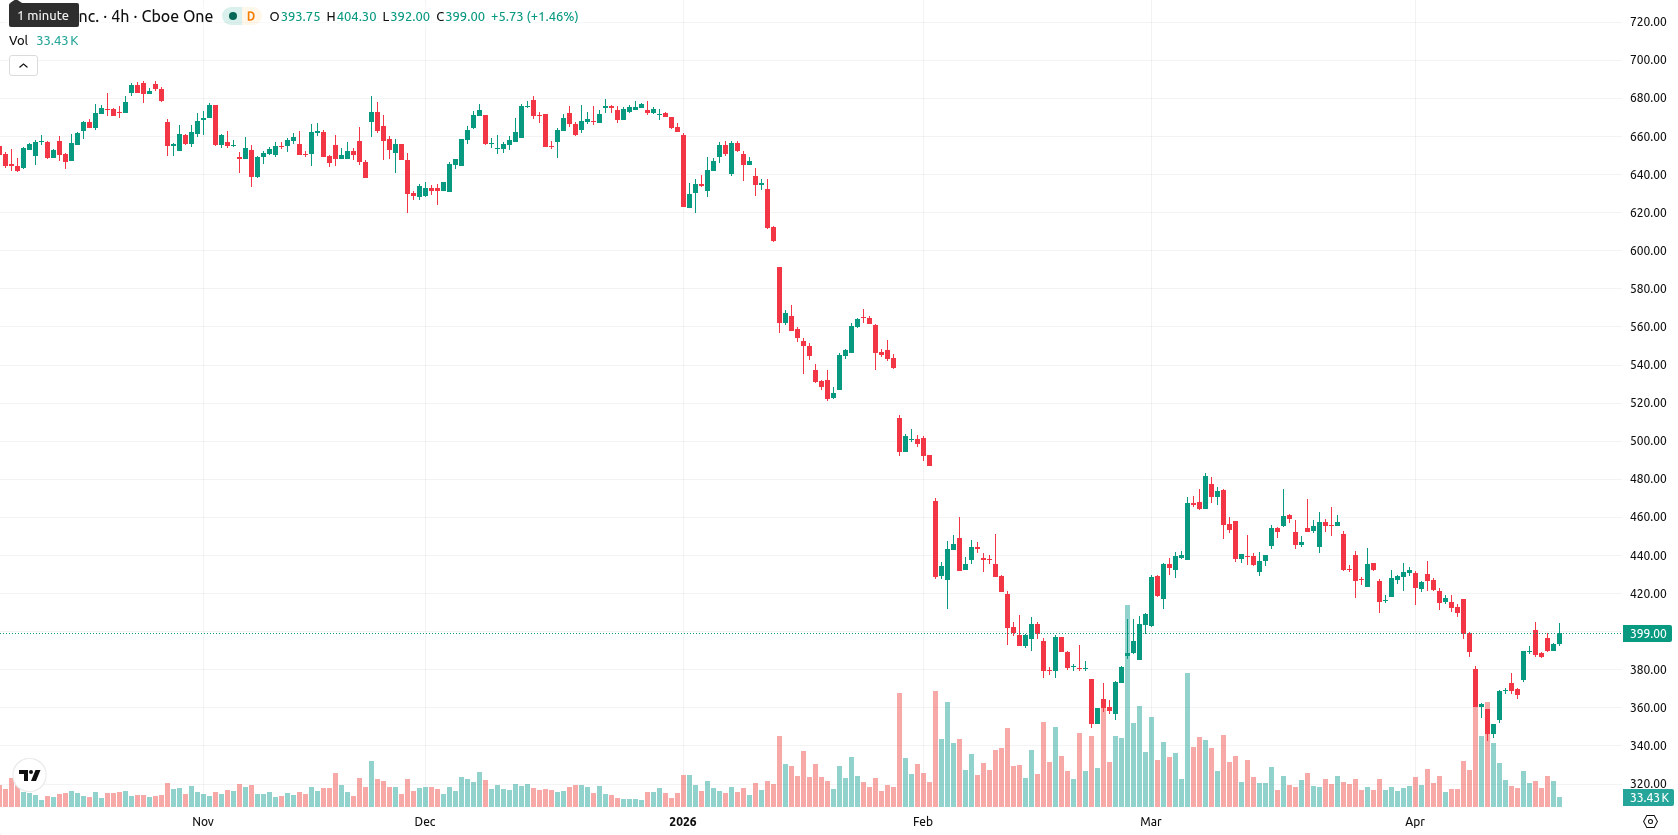
Intuit Inc. (INTU) is currently trading at $397.68, having gained $4.14 (1.21%) over the past week. The price remains well below its key weekly moving averages — MA-20 at $508.45, MA-50 at $626.30, and MA-200 at $557.66 — indicating persistent medium- and long-term selling pressure, with major averages now acting as dynamic resistance.
Highlights
- Intuit is trading well below major moving averages, reflecting persistent medium- and long-term selling pressure.
- Technical momentum remains negative overall, with sellers dominant despite a minor weekly price recovery and conflicting short-term indicators.
- INTU is expected to trade between $362.45 and $437.45 next week, with a greater likelihood of downside movement barring a breakout above resistance.
FedNow certification and fresh investor disclosures bolster sentiment this week
Intuit has achieved certification for the Federal Reserve's FedNow Service, allowing the company to offer real time payment capabilities through its financial software platform. This enhancement enables instant payroll, payables, and bill payment features for U.S. customers, further strengthening Intuit's value proposition for small and mid-sized businesses. Additionally, new investment positions in Intuit stock were disclosed by Birch Hill Investment Advisors LLC and Wealth Enhancement Trust Services Inc. during the fourth quarter.
Short-term buying meets persistent bearish momentum over the week
Weekly technical indicators for INTU remain broadly negative. The asset closed the week at the top of its trading range, but still sits below all major weekly moving averages. Volatility was high at 11.16%. The MACD and ADX point to strong bearish momentum, while the RSI (36.32), CCI, and Bull/Bear Power continue to show seller dominance. The Stochastic RSI is overbought, hinting at short-term buyer interest, but the Awesome Oscillator and other long-term signals reinforce a negative momentum bias, highlighting a disconnect between short-term strength and the longer-term downtrend.
Sideways consolidation likely as momentum fails to support breakout
For the next 5 trading days, INTU is expected to remain within the $362.45 – $437.45 range, consistent with recent weekly volatility. Momentum indicators do not suggest an imminent recovery — the probability of a sustained move higher is less than 20%. The baseline scenario is sideways consolidation between support and resistance. A close below $362.45 could trigger further downside and a retest of recent lows, while a breakout above $437.45 would require a substantial momentum shift, which is currently not supported by the weekly chart.
Earlier, analysts noted that Intuit was experiencing persistent downside pressure, with technical indicators and price action pointing to a prevailing bearish trend. The current analysis reinforces this outlook, as sustained weakness below major weekly averages and continued bearish momentum suggest risk remains skewed to the downside unless a clear breakout above the established resistance range materializes.


-
 Afghanistan
-
 Albania
-
 Algeria
-
 Angola
-
 Argentina
-
 Armenia
-
 Australia
-
 Austria
-
 Azerbaijan
-
 Bahamas
-
 Bahrain
-
 Bangladesh
-
 Belarus
-
 Belgium
-
 Bolivia
-
 Botswana
-
 Brazil
-
 Brunei
-
 Bulgaria
-
 Cambodia
-
 Cameroon
-
 Canada
-
 Chile
Chile
-
 China
China
-
 Colombia
-
 Congo
Congo
-
 Costa Rica
-
 Cote d'Ivoire
-
 Croatia
-
 Cuba
Cuba
-
 Cyprus
-
 Czechia
-
 DR Congo
-
 Denmark
-
 Dominican Republic
-
 Ecuador
-
 Egypt
Egypt
-
 El Salvador
-
 Estonia
-
 Eswatini
-
 Ethiopia
-
 Finland
-
 France
-
 Georgia
-
 Germany
-
 Ghana
Ghana
-
 Greece
-
 Haiti
Haiti
-
 Hong Kong
-
 Hungary
-
 India
India
-
 Indonesia
-
 Iran, Islamic republic
-
 Iraq
Iraq
-
 Ireland
-
 Israel
-
 Italy
Italy
-
 Jamaica
-
 Japan
Japan
-
 Jordan
-
 Kazakhstan
-
 Kenya
Kenya
-
 Korea
Korea
-
 Kuwait
-
 Kyrgyzstan
-
 Laos
Laos
-
 Latvia
-
 Lebanon
-
 Lesotho
-
 Libya
Libya
-
 Lithuania
-
 Luxembourg
-
 Madagascar
-
 Malaysia
-
 Malta
Malta
-
 Mauritius
-
 Mexico
-
 Moldova
-
 Mongolia
-
 Montenegro
-
 Morocco
-
 Mozambique
-
 Myanmar
-
 Namibia
-
 Nepal
Nepal
-
 Netherlands
-
 New Zealand
-
 Nigeria
-
 North Macedonia
-
 Norway
-
 Oman
Oman
-
 Pakistan
-
 Palestine
-
 Panama
-
 Papua New Guinea
-
 Paraguay
-
 Peru
Peru
-
 Philippines
-
 Poland
-
 Portugal
-
 Puerto Rico
-
 Qatar
Qatar
-
 Reunion
-
 Romania
-
 Rwanda
-
 Saudi Arabia
-
 Serbia
-
 Singapore
-
 Slovakia
-
 Slovenia
-
 Somalia
-
 South Africa
-
 Spain
Spain
-
 Sri Lanka
-
 Sweden
-
 Switzerland
-
 Syria
Syria
-
 Taiwan
-
 Tajikistan
-
 Tanzania
-
 Thailand
-
 Trinidad and Tobago
-
 Tunisia
-
 Turkey
-
 UAE
UAE
-
 Uganda
-
 Ukraine
-
 United Kingdom
-
United States
-
 Uruguay
-
 Uzbekistan
-
 Venezuela
-
 Vietnam
-
 Yemen
Yemen
-
 Zambia
-
 Zimbabwe
- Forex
- Crypto
