
Nvidia stock holds steady as new production ramps for Vera Rubin integrated

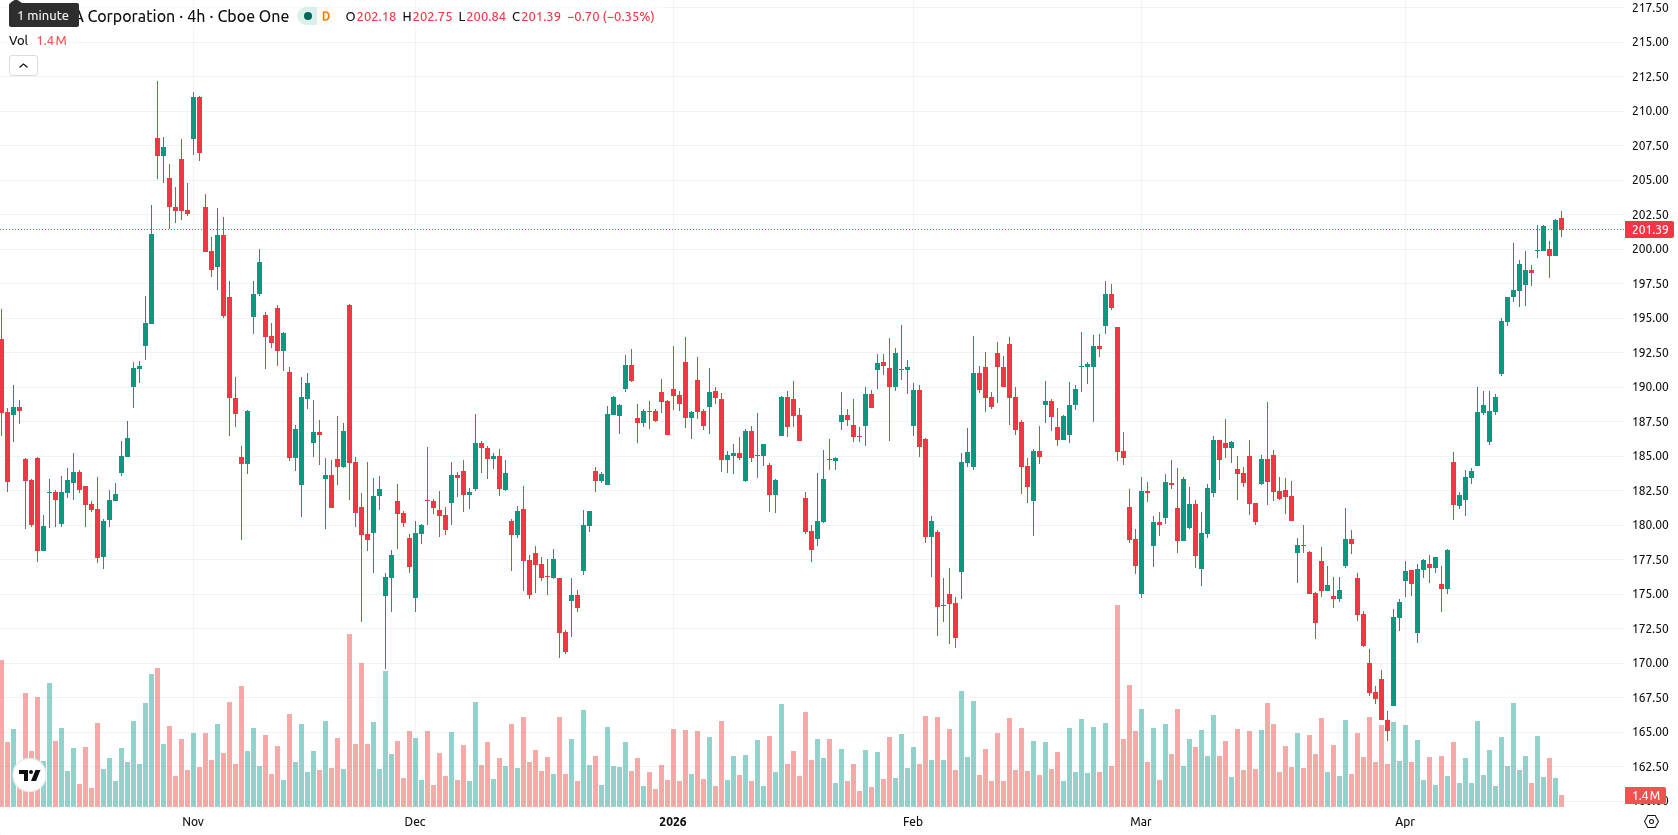
NVIDIA Corporation (NVDA) is trading at $201.95, recording a marginal decline of 0.03% on the day. The price remains well above its key moving averages, indicating strong positioning across short, medium, and long-term trends.
Highlights
- Nvidia maintains strong enterprise demand for its AI data center platforms, with Blackwell and Vera Rubin systems already factored into guidance.
- Recent institutional moves show a mix of share selling and acquisitions, while vulnerability research has not materially impacted stock action.
- NVDA trades in a bullish structure above key support, with consolidation expected between $194.00 and $207.00 despite overbought technical signals.
Investor rotation as institutional flows and AI momentum diverge
Nvidia has been the focus of attention for its AI data center offerings, with ongoing demand for Blackwell-based systems and new production ramps for Vera Rubin already included in earnings models. Recent institutional activity has seen both share reductions and acquisitions among several notable investors during the fourth quarter. The company's integrated AI hardware and software platform continues to attract enterprise customers, while Nvidia researchers have identified vulnerabilities in AI coding assistants related to AGENTS.md injection, though price action has remained under broader selling pressure.
Overbought risk grows as support holds and momentum moderates
The SMA-20 sits at $182.91, SMA-50 at $183.90, and SMA-200 at $181.99, all below the current price. On the D1 chart, the Ichimoku Kijun level is set at $183.31, acting as immediate support. Momentum remains positive according to MACD, with a weak trend signaled by ADX. The overbought condition is confirmed by RSI at 71.60, Stoch RSI at 100.00, CCI at 132.70, and the BBP indicator, all pointing to buyer dominance but signaling the market is stretched in the short term. Price is fluctuating in the middle of today's $201.25 – $201.61 range with low volatility and a largely sideways intraday pattern, where momentum from oscillators is moderated by overbought readings, creating a mild divergence.
Consolidation likely as bullish bias limits downside risk
Looking ahead to the coming week, typical volatility for NVDA suggests a price range of $194.00 – $207.00. The baseline scenario is for consolidation within this corridor, with an upwards move having a high probability while the chance of a significant decline remains low. If bullish momentum accelerates and resistance near current highs is surpassed, the price may attempt to break above $207.00. A sustained move below $194.00 would expose NVDA to a deeper correction, though major support is signaled by trend indicators on the weekly timeframe.
Previously it was reported that analysts maintained a broadly bullish outlook on Nvidia due to its strong technical positioning and sustained institutional interest. With current indicators highlighting both enduring momentum and persistent overbought conditions, traders should closely monitor the $207.00 resistance as a potential breakout point in the coming week.


-
 Afghanistan
-
 Albania
-
 Algeria
-
 Angola
-
 Argentina
-
 Armenia
-
 Australia
-
 Austria
-
 Azerbaijan
-
 Bahamas
-
 Bahrain
-
 Bangladesh
-
 Belarus
-
 Belgium
-
 Bolivia
-
 Botswana
-
 Brazil
-
 Brunei
-
 Bulgaria
-
 Cambodia
-
 Cameroon
-
 Canada
-
 Chile
Chile
-
 China
China
-
 Colombia
-
 Congo
Congo
-
 Costa Rica
-
 Cote d'Ivoire
-
 Croatia
-
 Cuba
Cuba
-
 Cyprus
-
 Czechia
-
 DR Congo
-
 Denmark
-
 Dominican Republic
-
 Ecuador
-
 Egypt
Egypt
-
 El Salvador
-
 Estonia
-
 Eswatini
-
 Ethiopia
-
 Finland
-
 France
-
 Georgia
-
 Germany
-
 Ghana
Ghana
-
 Greece
-
 Haiti
Haiti
-
 Hong Kong
-
 Hungary
-
 India
India
-
 Indonesia
-
 Iran, Islamic republic
-
 Iraq
Iraq
-
 Ireland
-
 Israel
-
 Italy
Italy
-
 Jamaica
-
 Japan
Japan
-
 Jordan
-
 Kazakhstan
-
 Kenya
Kenya
-
 Korea
Korea
-
 Kuwait
-
 Kyrgyzstan
-
 Laos
Laos
-
 Latvia
-
 Lebanon
-
 Lesotho
-
 Libya
Libya
-
 Lithuania
-
 Luxembourg
-
 Madagascar
-
 Malaysia
-
 Malta
Malta
-
 Mauritius
-
 Mexico
-
 Moldova
-
 Mongolia
-
 Montenegro
-
 Morocco
-
 Mozambique
-
 Myanmar
-
 Namibia
-
 Nepal
Nepal
-
 Netherlands
-
 New Zealand
-
 Nigeria
-
 North Macedonia
-
 Norway
-
 Oman
Oman
-
 Pakistan
-
 Palestine
-
 Panama
-
 Papua New Guinea
-
 Paraguay
-
 Peru
Peru
-
 Philippines
-
 Poland
-
 Portugal
-
 Puerto Rico
-
 Qatar
Qatar
-
 Reunion
-
 Romania
-
 Rwanda
-
 Saudi Arabia
-
 Serbia
-
 Singapore
-
 Slovakia
-
 Slovenia
-
 Somalia
-
 South Africa
-
 Spain
Spain
-
 Sri Lanka
-
 Sweden
-
 Switzerland
-
 Syria
Syria
-
 Taiwan
-
 Tajikistan
-
 Tanzania
-
 Thailand
-
 Trinidad and Tobago
-
 Tunisia
-
 Turkey
-
 UAE
UAE
-
 Uganda
-
 Ukraine
-
 United Kingdom
-
United States
-
 Uruguay
-
 Uzbekistan
-
 Venezuela
-
 Vietnam
-
 Yemen
Yemen
-
 Zambia
-
 Zimbabwe
- Forex
- Crypto
