
Intuit stock price forecast: $355 support level as INTU slides 5.24%

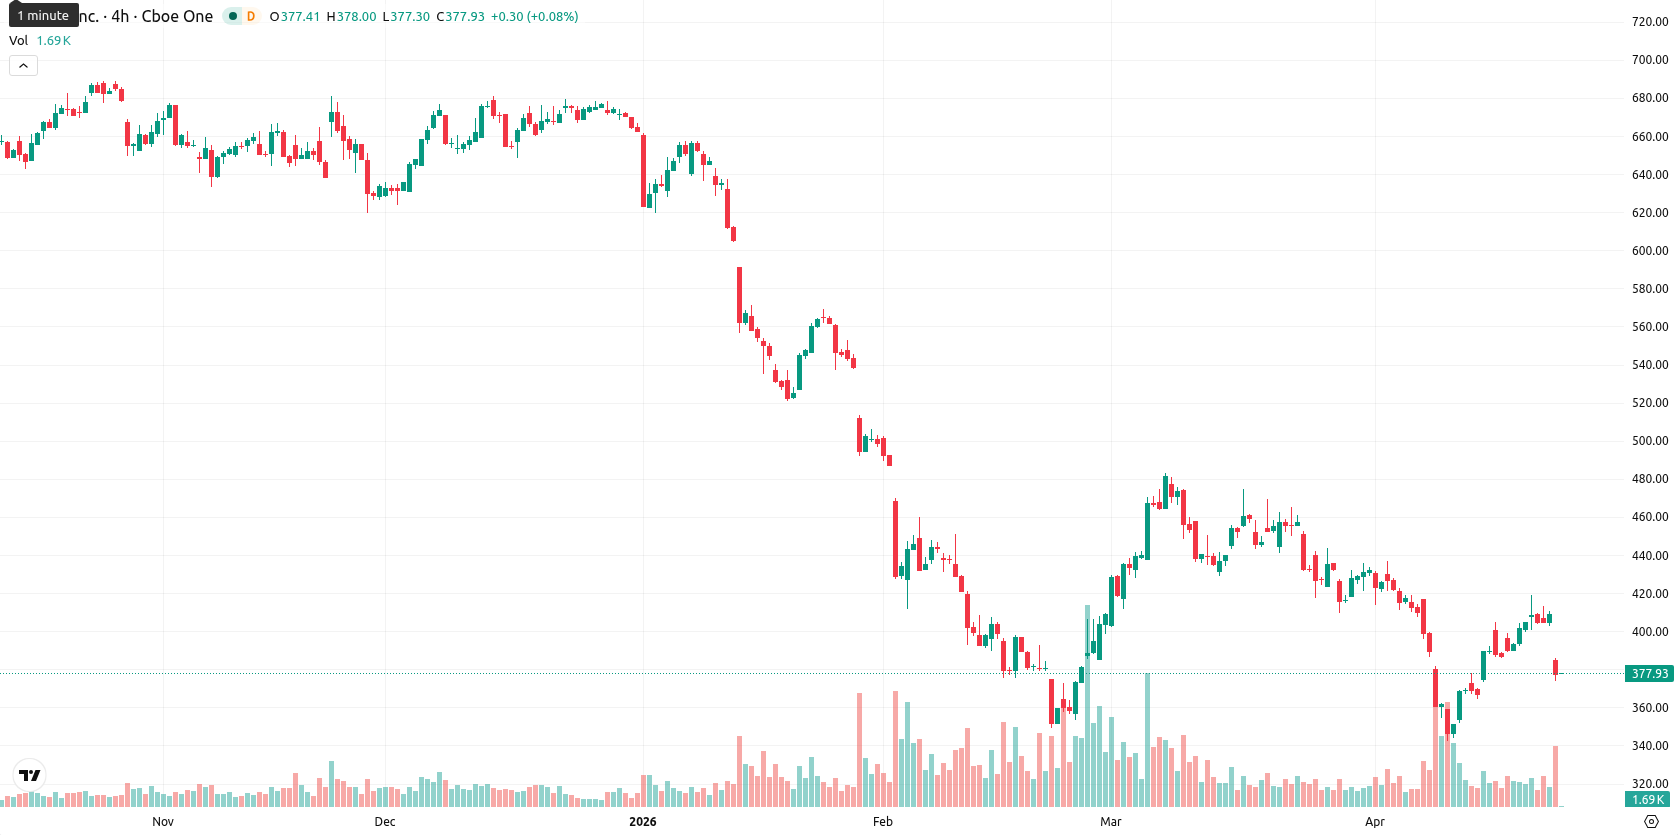
Intuit Inc. (INTU) is trading at $376.95, reflecting a daily decline of 5.24%. The price is positioned well below its key moving averages, indicating pronounced short-term and long-term weakness.
Highlights
- Intuit delivered better-than-expected Q2 FY26 earnings, maintaining double-digit revenue and EPS growth guidance for the year.
- Investor concerns persist regarding AI disruption risks and post-tax season revenue pressure, despite strong full-service adoption within core platforms.
- INTU trades under significant selling pressure with bearish momentum, expected to consolidate between $355 and $385 over the next week barring a decisive move below support.
Earnings beat met with AI disruption risk and ongoing selling
Intuit reported Q2 FY26 results that exceeded estimates, with double-digit revenue and EPS growth reaffirmed for the fiscal year. Investor focus remains on risks from AI-driven disruption and the seasonal tax business especially following the April tax filing peak. Strong momentum was noted for QuickBooks and TurboTax's full-service adoption, though price action has remained under broader selling pressure.
Sustained weakness as technical signals flag persistent bearish momentum
INTU is currently trading well below the SMA-20 ($401.48), SMA-50 ($414.48), and SMA-200 ($601.48), while the Ichimoku Kijun level at $408.62 acts as immediate resistance. The session began with a gap down from $397.79 to $382.82, and price action has remained near the intraday low of $374.15 amidst heightened volatility. MACD is on a strong sell signal and ADX reads 23.92, indicating a moderate but clearly negative trend. The RSI is at 45.98 (sell), Stoch RSI signals overbought, and CCI is neutral, while BBP shows a strong overbought condition despite sellers controlling intraday momentum.
Sideways trading anticipated amid low rebound probability
Over the next five trading days, INTU is forecast to fluctuate within a typical volatility band between $355 and $385 based on recent price action. There is a low probability (less than 20%) of a sustained rebound, with the baseline scenario anticipating extended consolidation above key support. A decisive break above the $408–$410 resistance area could improve sentiment, while a close below $355 may trigger further technical selling.
Earlier, analysts noted that Intuit was experiencing sustained bearish momentum, with technical indicators and price action suggesting continued downside risk. The current pullback alongside persistent weakness below moving averages reinforces that view, making the $355 support and the $408–$410 resistance range critical levels to monitor for any shift in near-term direction.


-
 Afghanistan
-
 Albania
-
 Algeria
-
 Angola
-
 Argentina
-
 Armenia
-
 Australia
-
 Austria
-
 Azerbaijan
-
 Bahamas
-
 Bahrain
-
 Bangladesh
-
 Belarus
-
 Belgium
-
 Bolivia
-
 Botswana
-
 Brazil
-
 Brunei
-
 Bulgaria
-
 Cambodia
-
 Cameroon
-
 Canada
-
 Chile
Chile
-
 China
China
-
 Colombia
-
 Congo
Congo
-
 Costa Rica
-
 Cote d'Ivoire
-
 Croatia
-
 Cuba
Cuba
-
 Cyprus
-
 Czechia
-
 DR Congo
-
 Denmark
-
 Dominican Republic
-
 Ecuador
-
 Egypt
Egypt
-
 El Salvador
-
 Estonia
-
 Eswatini
-
 Ethiopia
-
 Finland
-
 France
-
 Georgia
-
 Germany
-
 Ghana
Ghana
-
 Greece
-
 Haiti
Haiti
-
 Hong Kong
-
 Hungary
-
 India
India
-
 Indonesia
-
 Iran, Islamic republic
-
 Iraq
Iraq
-
 Ireland
-
 Israel
-
 Italy
Italy
-
 Jamaica
-
 Japan
Japan
-
 Jordan
-
 Kazakhstan
-
 Kenya
Kenya
-
 Korea
Korea
-
 Kuwait
-
 Kyrgyzstan
-
 Laos
Laos
-
 Latvia
-
 Lebanon
-
 Lesotho
-
 Libya
Libya
-
 Lithuania
-
 Luxembourg
-
 Madagascar
-
 Malaysia
-
 Malta
Malta
-
 Mauritius
-
 Mexico
-
 Moldova
-
 Mongolia
-
 Montenegro
-
 Morocco
-
 Mozambique
-
 Myanmar
-
 Namibia
-
 Nepal
Nepal
-
 Netherlands
-
 New Zealand
-
 Nigeria
-
 North Macedonia
-
 Norway
-
 Oman
Oman
-
 Pakistan
-
 Palestine
-
 Panama
-
 Papua New Guinea
-
 Paraguay
-
 Peru
Peru
-
 Philippines
-
 Poland
-
 Portugal
-
 Puerto Rico
-
 Qatar
Qatar
-
 Reunion
-
 Romania
-
 Rwanda
-
 Saudi Arabia
-
 Serbia
-
 Singapore
-
 Slovakia
-
 Slovenia
-
 Somalia
-
 South Africa
-
 Spain
Spain
-
 Sri Lanka
-
 Sweden
-
 Switzerland
-
 Syria
Syria
-
 Taiwan
-
 Tajikistan
-
 Tanzania
-
 Thailand
-
 Trinidad and Tobago
-
 Tunisia
-
 Turkey
-
 UAE
UAE
-
 Uganda
-
 Ukraine
-
 United Kingdom
-
United States
-
 Uruguay
-
 Uzbekistan
-
 Venezuela
-
 Vietnam
-
 Yemen
Yemen
-
 Zambia
-
 Zimbabwe
- Forex
- Crypto
