
-3.08% for Coinbase stock as company faces post-restructuring pressures

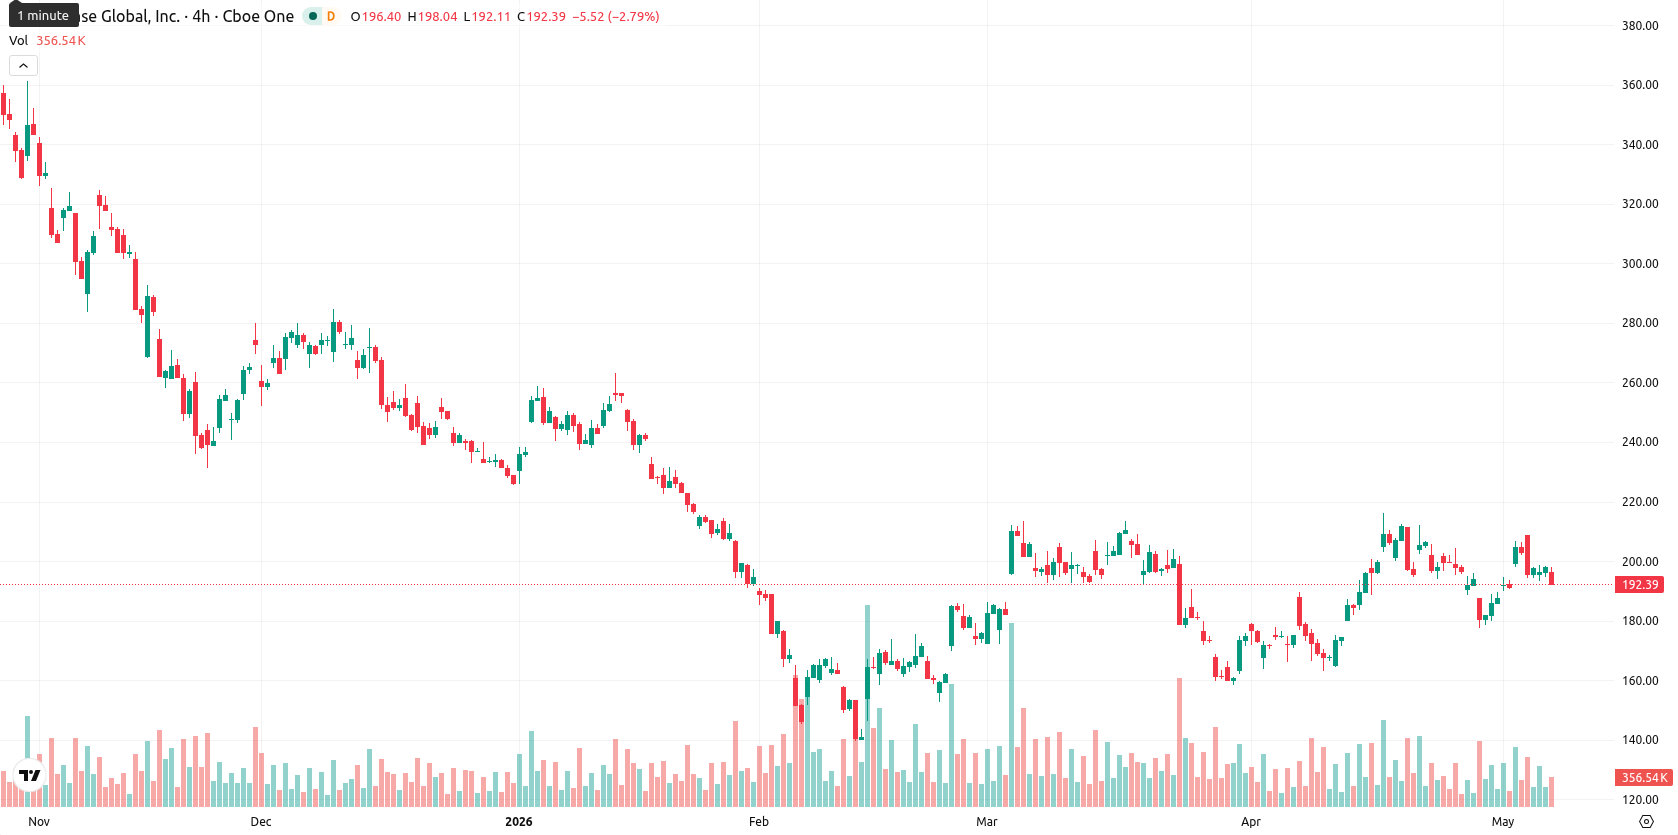
Coinbase Global, Inc. (COIN) is trading at $192.48, marking a daily decline of 3.08%. The price currently sits just below its short-term moving averages and above its medium-term trend markers.
Highlights
- Coinbase implemented a major restructuring in Q1 2026, cutting 14% of its workforce with $50–$60 million in associated costs to boost efficiency.
- The company expanded its product suite by launching Gold and Silver perpetual futures for non-US clients, amid persistent crypto market volatility.
- Technicals indicate short-term selling pressure and weak trend momentum, with price likely to fluctuate between $185 and $205 in the coming week.
Restructuring costs and overseas products amid persistent selling pressure
Coinbase reported first quarter 2026 earnings, which followed a significant company-wide restructuring that reduced the workforce by approximately 14%, or about 700 jobs. The restructuring, announced on May 5 by CEO Brian Armstrong, was accompanied by estimated costs of $50–$60 million, primarily for severance and termination, with the aim of concluding the process in the second quarter. These measures were positioned as efforts to streamline operations and improve efficiency, while recent product initiatives such as the launch of Gold and Silver perpetual futures for non-US traders broadened the company's offering. All actions have taken place within an environment of ongoing crypto market volatility, though price action has remained under broader selling pressure.
Mixed technical signals as bullish momentum diverges from intraday weakness
Technically, the price is just below the SMA-20 at $193.06, sits above the SMA-50 at $189.68, and remains well below the SMA-200 at $260.89. The Ichimoku Kijun line at $189.11 offers nearby support. Immediate resistance appears at $193, with higher resistance at the weekly high near $205; support sits at $189 with a next downside target at $185. MACD on the daily timeframe stays in buy territory, but the ADX reading of 10.90 highlights a lack of trend strength. RSI is neutral to mildly bullish. Stoch RSI and CCI present no clear overbought or oversold signals, while BBP indicates intraday buyer dominance. The Awesome Oscillator aligns with the broader uptrend, but today's session sees notable selling pressure and price action near session lows, reflecting moderate volatility and a divergence between short-term bullish signals and intraday weakness.
Sideways trading expected as breakout odds remain low
Over the next five trading days, COIN is expected to fluctuate in a typical volatility band between $185 and $205. The likelihood of an upward breakout above resistance at $193 and the weekly high near $205 is less than 20%. Instead, the baseline scenario points to continued sideways movement near current levels. Should support at $189 give way, the next downside area to watch would be $185.
Previously it was reported that analysts expected Coinbase shares to remain under pressure as restructuring efforts and cost controls were met with ongoing market volatility. With the current technical landscape showing a lack of trend strength and the stock trading just below short-term resistance, traders should focus on the $193 level as a key gauge for any shift in directional momentum.


-
 Afghanistan
-
 Albania
-
 Algeria
-
 Angola
-
 Argentina
-
 Armenia
-
 Australia
-
 Austria
-
 Azerbaijan
-
 Bahamas
-
 Bahrain
-
 Bangladesh
-
 Belarus
-
 Belgium
-
 Bolivia
-
 Botswana
-
 Brazil
-
 Brunei
-
 Bulgaria
-
 Cambodia
-
 Cameroon
-
 Canada
-
 Chile
Chile
-
 China
China
-
 Colombia
-
 Congo
Congo
-
 Costa Rica
-
 Cote d'Ivoire
-
 Croatia
-
 Cuba
Cuba
-
 Cyprus
-
 Czechia
-
 DR Congo
-
 Denmark
-
 Dominican Republic
-
 Ecuador
-
 Egypt
Egypt
-
 El Salvador
-
 Estonia
-
 Eswatini
-
 Ethiopia
-
 Finland
-
 France
-
 Georgia
-
 Germany
-
 Ghana
Ghana
-
 Greece
-
 Haiti
Haiti
-
 Hong Kong
-
 Hungary
-
 India
India
-
 Indonesia
-
 Iran, Islamic republic
-
 Iraq
Iraq
-
 Ireland
-
 Israel
-
 Italy
Italy
-
 Jamaica
-
 Japan
Japan
-
 Jordan
-
 Kazakhstan
-
 Kenya
Kenya
-
 Korea
Korea
-
 Kuwait
-
 Kyrgyzstan
-
 Laos
Laos
-
 Latvia
-
 Lebanon
-
 Lesotho
-
 Libya
Libya
-
 Lithuania
-
 Luxembourg
-
 Madagascar
-
 Malaysia
-
 Malta
Malta
-
 Mauritius
-
 Mexico
-
 Moldova
-
 Mongolia
-
 Montenegro
-
 Morocco
-
 Mozambique
-
 Myanmar
-
 Namibia
-
 Nepal
Nepal
-
 Netherlands
-
 New Zealand
-
 Nigeria
-
 North Macedonia
-
 Norway
-
 Oman
Oman
-
 Pakistan
-
 Palestine
-
 Panama
-
 Papua New Guinea
-
 Paraguay
-
 Peru
Peru
-
 Philippines
-
 Poland
-
 Portugal
-
 Puerto Rico
-
 Qatar
Qatar
-
 Reunion
-
 Romania
-
 Rwanda
-
 Saudi Arabia
-
 Serbia
-
 Singapore
-
 Slovakia
-
 Slovenia
-
 Somalia
-
 South Africa
-
 Spain
Spain
-
 Sri Lanka
-
 Sweden
-
 Switzerland
-
 Syria
Syria
-
 Taiwan
-
 Tajikistan
-
 Tanzania
-
 Thailand
-
 Trinidad and Tobago
-
 Tunisia
-
 Turkey
-
 UAE
UAE
-
 Uganda
-
 Ukraine
-
 United Kingdom
-
United States
-
 Uruguay
-
 Uzbekistan
-
 Venezuela
-
 Vietnam
-
 Yemen
Yemen
-
 Zambia
-
 Zimbabwe
- Forex
- Crypto
