
Post-earnings selling pressure drives Nano Dimension stock down 2.63%

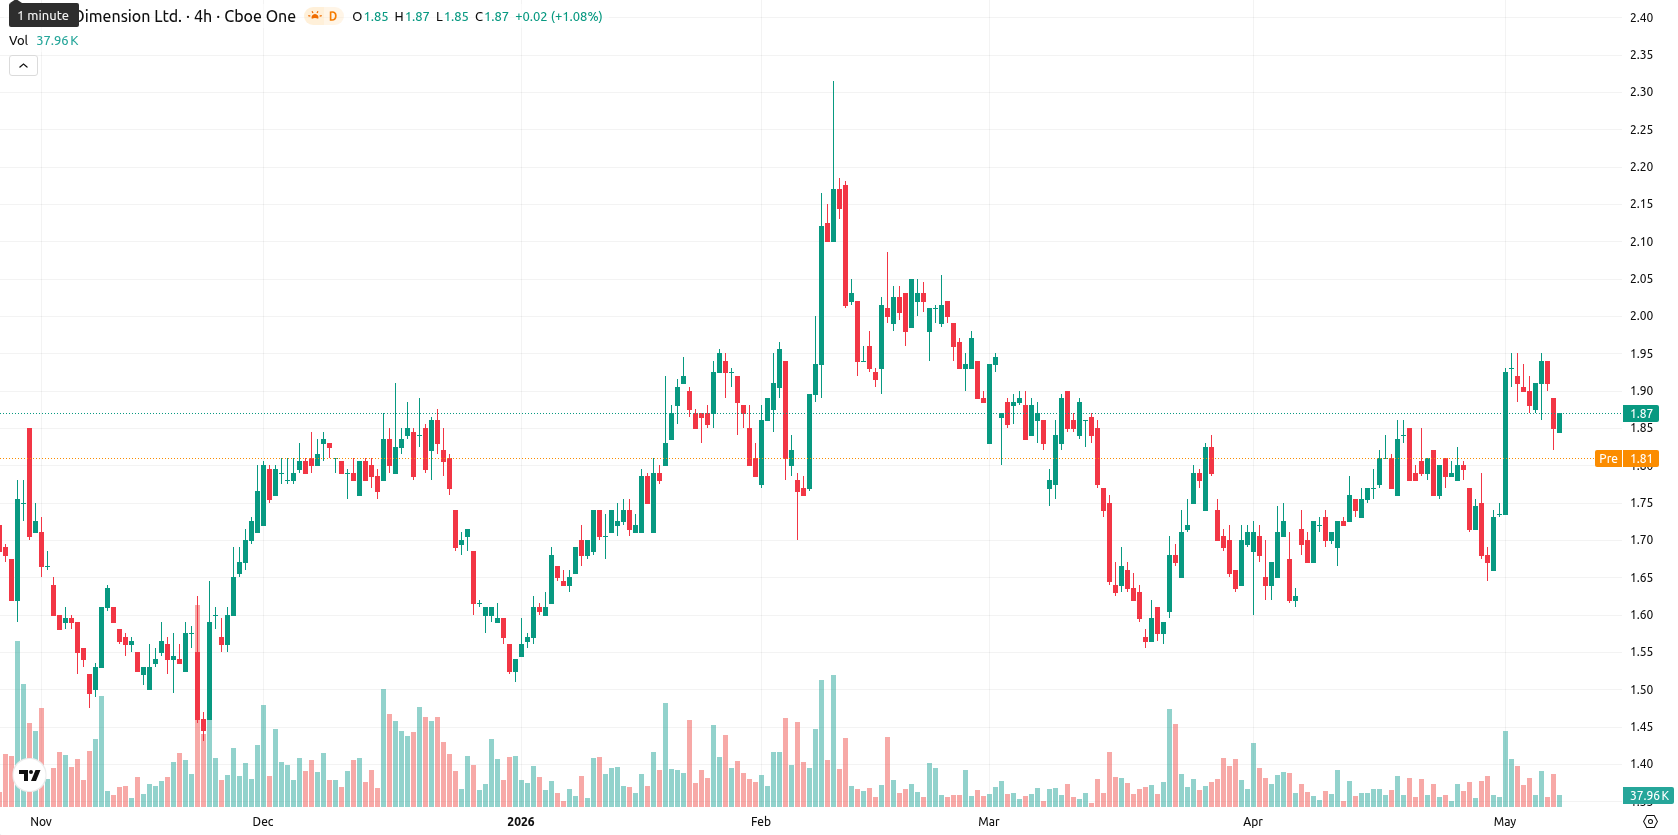
Nano Dimension Ltd (NNDM) is trading at $1.85, having moved down 2.63% from the previous close. The asset remains positioned above its key moving averages, indicating continued constructive trends across timeframes.
Highlights
- Nano Dimension reported Q4 2025 earnings and confirmed ongoing cost reductions, divestitures, and strategic asset reviews to enhance shareholder value.
- The board has engaged advisors to monetize assets and explore merger opportunities, increasing focus on near-term liquidity amid persistent selling pressure.
- Despite generally bullish longer-term technical trends, near-term price action is rangebound between $1.83 and $1.88 with mixed momentum signals and low volatility.
Strategic review and cost actions as selling pressure challenges shares
Nano Dimension published its Q4 2025 earnings on May 7, 2026, fulfilling financial disclosure obligations and providing updated insight into operational performance. The company detailed ongoing portfolio changes through cost reductions, divestitures, and expansion at the product level, alongside a sharpened focus on near-term liquidity management. Advisory firms have been engaged to monetize assets and explore potential merger scenarios, with the board emphasizing its commitment to maximizing shareholder value as the strategic review advances, though price action has remained under broader selling pressure.
Weakened trend strength despite mild bullish momentum signals
On the daily chart, NNDM sits above the MA-20 ($1.80), MA-50 ($1.77), and MA-200 ($1.68), with immediate support defined by the Ichimoku Kijun at $1.78. Mild bullish momentum is observed in MACD and ADX, though the ADX level of 12.39 shows that trend strength is weak. RSI and CCI are both in neutral to mildly bullish territory, while the Stoch RSI issues a strong sell signal, suggesting potential short-term downside. Bull/Bear Power (BBP) remains slightly positive intraday, and the Awesome Oscillator (AO) continues to support a constructive bias, though today’s price action is concentrated near the lower end of the $1.82–$1.89 daily range, reflecting clear post-open pressure and moderately low volatility.
Balanced breakout risks as sideways base scenario prevails
Over the next five trading days, the typical volatility band is projected at $1.83 to $1.88. Given the current mixed signals across trend and momentum indicators, upward and downward price moves are considered equally probable, each with a moderate likelihood. The base scenario anticipates sideways price behavior within this defined range. A sustained break above $1.88 could trigger further gains, while a decline beneath $1.83 may open the way for continued downside and tests of additional support levels.
Earlier, analysts noted that Nano Dimension was exhibiting a constructive technical setup with contained volatility, though signs of overextension warranted caution. The latest trading and earnings updates add a new dimension to the outlook, as corporate actions and neutral momentum suggest traders should monitor any departure from the $1.83–$1.88 range for the next directional move.


Latest Nano Dimension News


-
 Afghanistan
-
 Albania
-
 Algeria
-
 Angola
-
 Argentina
-
 Armenia
-
 Australia
-
 Austria
-
 Azerbaijan
-
 Bahamas
-
 Bahrain
-
 Bangladesh
-
 Belarus
-
 Belgium
-
 Bolivia
-
 Botswana
-
 Brazil
-
 Brunei
-
 Bulgaria
-
 Cambodia
-
 Cameroon
-
 Canada
-
 Chile
Chile
-
 China
China
-
 Colombia
-
 Congo
Congo
-
 Costa Rica
-
 Cote d'Ivoire
-
 Croatia
-
 Cuba
Cuba
-
 Cyprus
-
 Czechia
-
 DR Congo
-
 Denmark
-
 Dominican Republic
-
 Ecuador
-
 Egypt
Egypt
-
 El Salvador
-
 Estonia
-
 Eswatini
-
 Ethiopia
-
 Finland
-
 France
-
 Georgia
-
 Germany
-
 Ghana
Ghana
-
 Greece
-
 Haiti
Haiti
-
 Hong Kong
-
 Hungary
-
 India
India
-
 Indonesia
-
 Iran, Islamic republic
-
 Iraq
Iraq
-
 Ireland
-
 Israel
-
 Italy
Italy
-
 Jamaica
-
 Japan
Japan
-
 Jordan
-
 Kazakhstan
-
 Kenya
Kenya
-
 Korea
Korea
-
 Kuwait
-
 Kyrgyzstan
-
 Laos
Laos
-
 Latvia
-
 Lebanon
-
 Lesotho
-
 Libya
Libya
-
 Lithuania
-
 Luxembourg
-
 Madagascar
-
 Malaysia
-
 Malta
Malta
-
 Mauritius
-
 Mexico
-
 Moldova
-
 Mongolia
-
 Montenegro
-
 Morocco
-
 Mozambique
-
 Myanmar
-
 Namibia
-
 Nepal
Nepal
-
 Netherlands
-
 New Zealand
-
 Nigeria
-
 North Macedonia
-
 Norway
-
 Oman
Oman
-
 Pakistan
-
 Palestine
-
 Panama
-
 Papua New Guinea
-
 Paraguay
-
 Peru
Peru
-
 Philippines
-
 Poland
-
 Portugal
-
 Puerto Rico
-
 Qatar
Qatar
-
 Reunion
-
 Romania
-
 Rwanda
-
 Saudi Arabia
-
 Serbia
-
 Singapore
-
 Slovakia
-
 Slovenia
-
 Somalia
-
 South Africa
-
 Spain
Spain
-
 Sri Lanka
-
 Sweden
-
 Switzerland
-
 Syria
Syria
-
 Taiwan
-
 Tajikistan
-
 Tanzania
-
 Thailand
-
 Trinidad and Tobago
-
 Tunisia
-
 Turkey
-
 UAE
UAE
-
 Uganda
-
 Ukraine
-
 United Kingdom
-
United States
-
 Uruguay
-
 Uzbekistan
-
 Venezuela
-
 Vietnam
-
 Yemen
Yemen
-
 Zambia
-
 Zimbabwe
- Forex
- Crypto
