
Buyers pushing above recent price range lifts Hut 8 stock higher

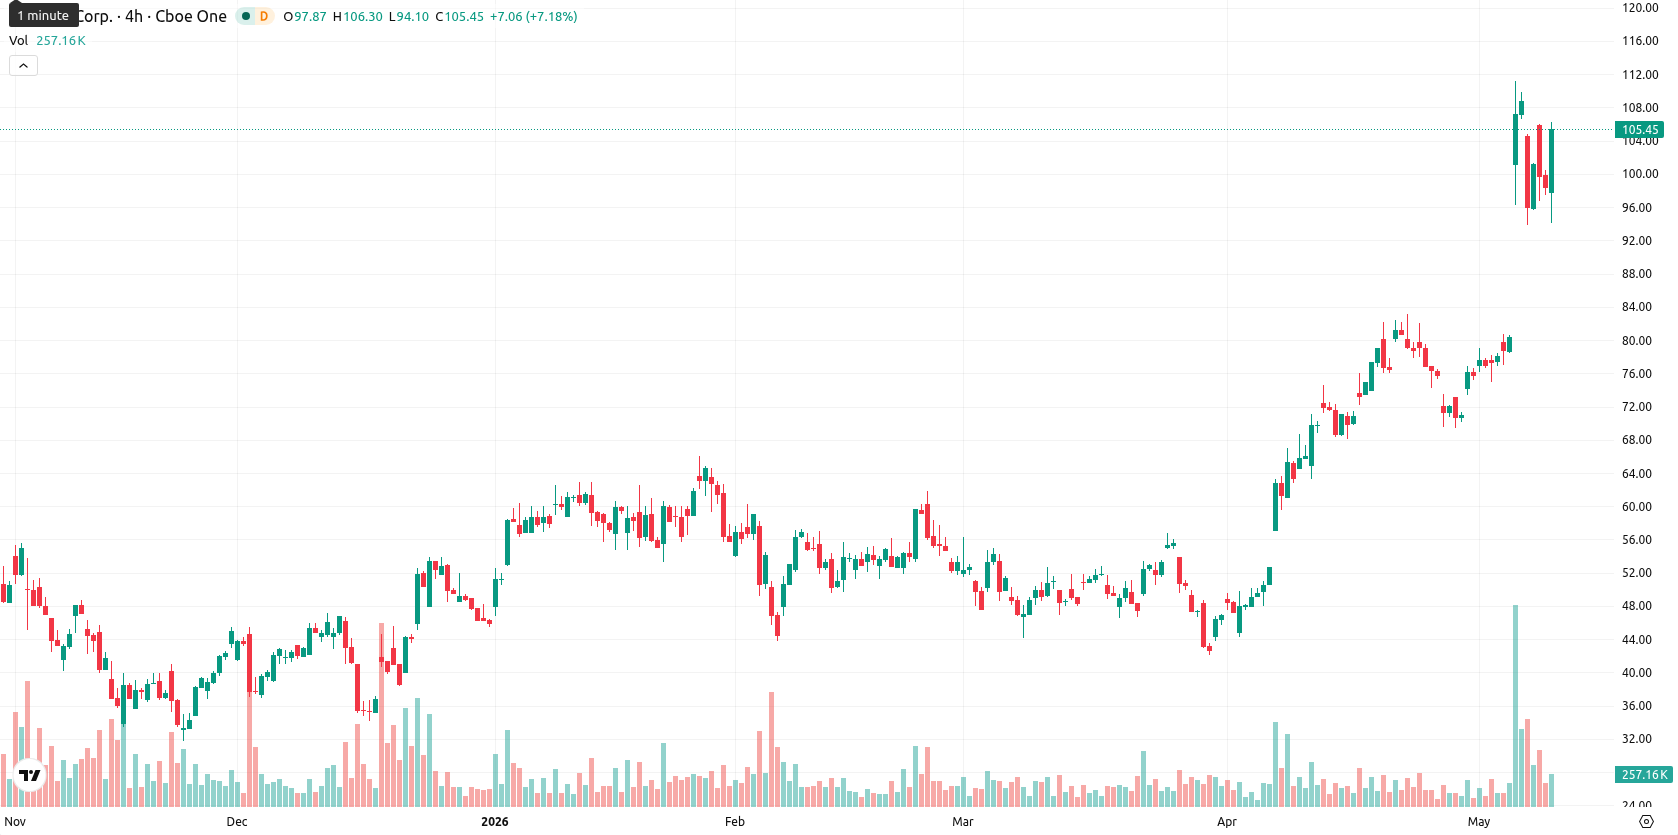
Hut 8 Corp (HUT) is trading at $105.40, marking a daily gain of 7.04%. The current price stands well above its key moving averages, reflecting strong bullish momentum across multiple time frames.
Highlights
- HUT maintains robust bullish momentum, trading significantly above short-, medium-, and long-term trend indicators.
- Momentum oscillators are strongly bullish but show overbought conditions, indicating elevated risk of near-term exhaustion or pullback.
- Expected trading range over the next five days is $95.00 to $115.00, with upside extension possible but corrective downside risk if below $95.00.
Upside momentum persists as overbought signals and volatility rise
Technically, HUT is trading significantly above the SMA-20 ($79.45), SMA-50 ($62.58), and SMA-200 ($46.91), underscoring momentum across all major timeframes. The Ichimoku Kijun line at $78.63 offers near-term support. Momentum indicators on the daily chart, such as MACD and ADX, confirm the strength of the ongoing upswing. However, overbought signals are evident with the RSI at 69.39 and the CCI at 193.48, and BBP continues to show dominant buyer control. Stoch RSI is neutral on the daily timeframe but highlights overbought conditions intraday, which may point to possible short-term fatigue. The Awesome Oscillator also supports upside momentum, while today's price action shows a rapid climb toward the intraday high of $106.33 amid heightened volatility. Several oscillators warn that momentum could be stretched, with divergence between continued buying and overbought readings.
Sideways trend expected as upside risk outpaces correction odds
Looking ahead to the next five trading days, HUT is likely to fluctuate between $95.00 and $115.00, in line with its typical volatility band relative to current levels. There is a very high probability — above 80% — of further price advances, while the chance of a decline remains minimal. The baseline scenario assumes sideways movement within this corridor. If a bullish breakout occurs, HUT could push above $115.00; conversely, a drop below $95.00 would likely trigger profit taking in this overbought context.
Earlier, analysts noted that Hut 8’s robust technical structure and enhanced liquidity supported a prevailing bullish trend amid ongoing market volatility. The current analysis reinforces this outlook with sustained upside momentum, but heightened overbought signals mean traders should closely monitor the potential for short-term pauses or consolidation near current highs.


Latest Hut 8 News


-
 Afghanistan
-
 Albania
-
 Algeria
-
 Angola
-
 Argentina
-
 Armenia
-
 Australia
-
 Austria
-
 Azerbaijan
-
 Bahamas
-
 Bahrain
-
 Bangladesh
-
 Belarus
-
 Belgium
-
 Bolivia
-
 Botswana
-
 Brazil
-
 Brunei
-
 Bulgaria
-
 Cambodia
-
 Cameroon
-
 Canada
-
 Chile
Chile
-
 China
China
-
 Colombia
-
 Congo
Congo
-
 Costa Rica
-
 Cote d'Ivoire
-
 Croatia
-
 Cuba
Cuba
-
 Cyprus
-
 Czechia
-
 DR Congo
-
 Denmark
-
 Dominican Republic
-
 Ecuador
-
 Egypt
Egypt
-
 El Salvador
-
 Estonia
-
 Eswatini
-
 Ethiopia
-
 Finland
-
 France
-
 Georgia
-
 Germany
-
 Ghana
Ghana
-
 Greece
-
 Haiti
Haiti
-
 Hong Kong
-
 Hungary
-
 India
India
-
 Indonesia
-
 Iran, Islamic republic
-
 Iraq
Iraq
-
 Ireland
-
 Israel
-
 Italy
Italy
-
 Jamaica
-
 Japan
Japan
-
 Jordan
-
 Kazakhstan
-
 Kenya
Kenya
-
 Korea
Korea
-
 Kuwait
-
 Kyrgyzstan
-
 Laos
Laos
-
 Latvia
-
 Lebanon
-
 Lesotho
-
 Libya
Libya
-
 Lithuania
-
 Luxembourg
-
 Madagascar
-
 Malaysia
-
 Malta
Malta
-
 Mauritius
-
 Mexico
-
 Moldova
-
 Mongolia
-
 Montenegro
-
 Morocco
-
 Mozambique
-
 Myanmar
-
 Namibia
-
 Nepal
Nepal
-
 Netherlands
-
 New Zealand
-
 Nigeria
-
 North Macedonia
-
 Norway
-
 Oman
Oman
-
 Pakistan
-
 Palestine
-
 Panama
-
 Papua New Guinea
-
 Paraguay
-
 Peru
Peru
-
 Philippines
-
 Poland
-
 Portugal
-
 Puerto Rico
-
 Qatar
Qatar
-
 Reunion
-
 Romania
-
 Rwanda
-
 Saudi Arabia
-
 Serbia
-
 Singapore
-
 Slovakia
-
 Slovenia
-
 Somalia
-
 South Africa
-
 Spain
Spain
-
 Sri Lanka
-
 Sweden
-
 Switzerland
-
 Syria
Syria
-
 Taiwan
-
 Tajikistan
-
 Tanzania
-
 Thailand
-
 Trinidad and Tobago
-
 Tunisia
-
 Turkey
-
 UAE
UAE
-
 Uganda
-
 Ukraine
-
 United Kingdom
-
United States
-
 Uruguay
-
 Uzbekistan
-
 Venezuela
-
 Vietnam
-
 Yemen
Yemen
-
 Zambia
-
 Zimbabwe
- Forex
- Crypto
