
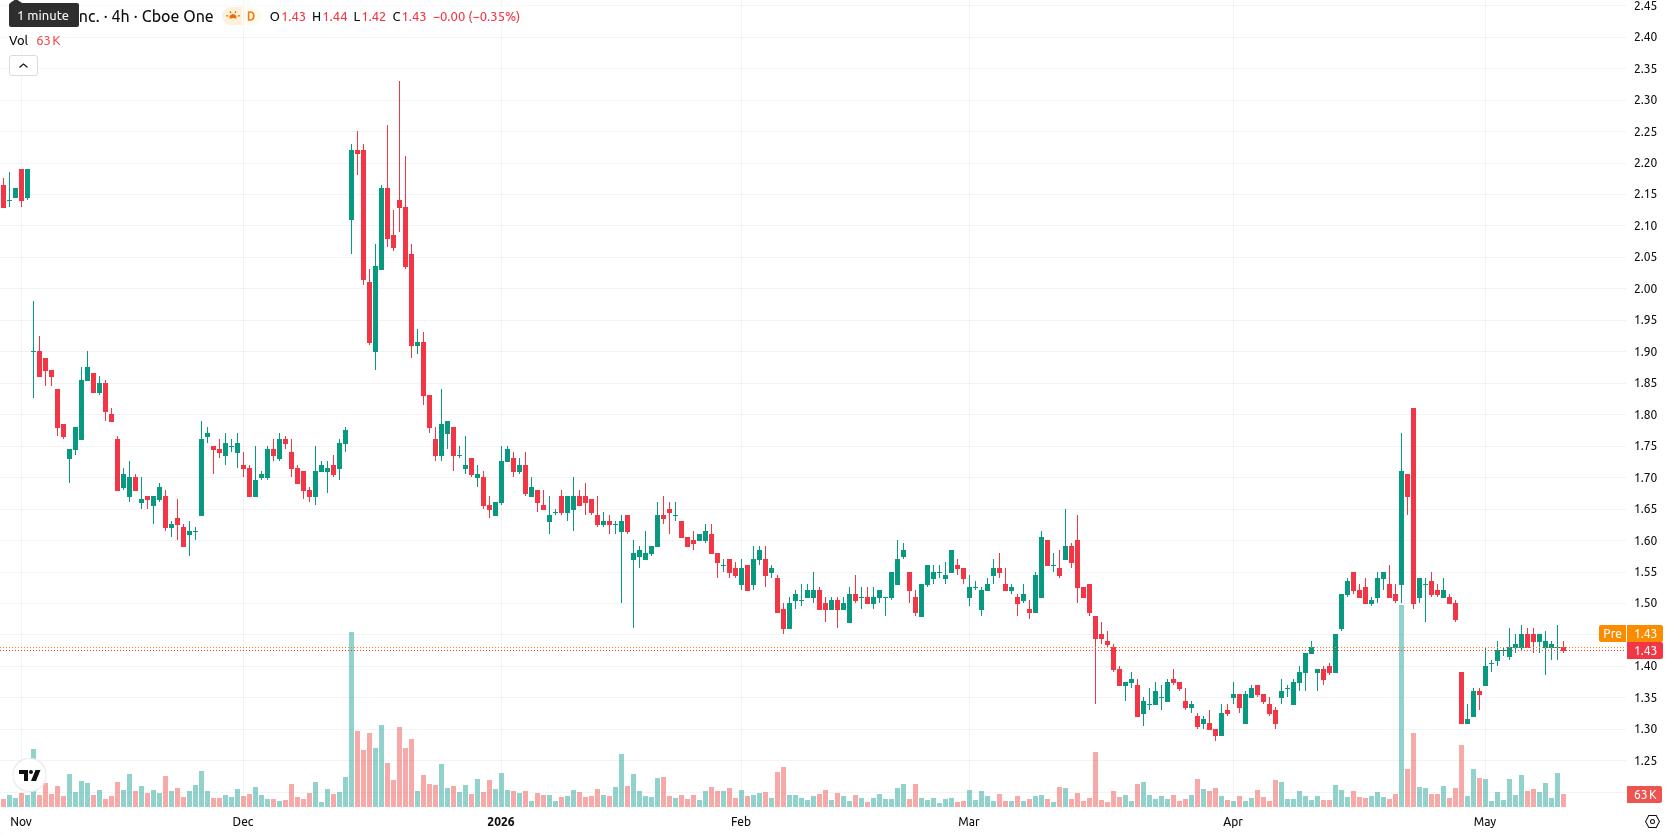
$1.40 support helps Sundial Growers stock steady near recent lows

Sundial Growers Inc. (SNDL) is trading at $1.43, down 0.70% on the day and positioned below its key moving averages. The current price action reflects ongoing seller pressure, as the asset sits under short- and long-term averages.
Highlights
- SNDL remains under persistent selling pressure, trading below major moving averages and facing immediate resistance at 1.47–1.56.
- Momentum and trend indicators are broadly bearish, with day-to-day signals hinting at short-term seller exhaustion but no reversal.
- The next five trading days are likely to see sideways or lower price action within a 1.40–1.48 range, with little probability of a sustained rebound.
Layered resistance and weak momentum as technical signals diverge
SNDL is currently trading below the MA-20 ($1.47), MA-50 ($1.44), and MA-200 ($1.83) moving averages, indicating layer upon layer of overhead resistance. The Ichimoku Kijun level at $1.56 marks the nearest significant resistance point. On the D1 timeframe, momentum indicators register weak or neutral readings: MACD remains in sell territory, the ADX prints 21.31 suggesting only modest trend strength, RSI is at 48.14, and CCI sits at -43.32. Several oscillators, including Stoch RSI and intraday timeframes, report oversold conditions, but Bull/Bear Power (BBP) on D1 is barely positive, corresponding to mixed intraday dominance between buyers and sellers. Awesome Oscillator's D1 buy signal has appeared, though it diverges from the broader bearish structure, while intraday volatility remains subdued with the price parked near the lower end of today's $1.42–$1.46 band.
Sideways outlook likely as resistance limits upside potential
Over the next five trading days, SNDL is expected to remain confined within a $1.40–$1.48 price corridor, reflecting the asset's typical volatility band relative to current levels. The probability of a sustained move higher is considered very low (less than 20%), as weekly RSI, ADX, MACD, and the MA-50 do not support a bullish scenario. The base case is sideways movement within this range, with upside capped by resistance at $1.47–$1.56. A daily close above the Kijun and MA-20 would be necessary to shift momentum to the upside, whereas a drop below $1.40 would expose further near-term weakness and limited underlying support.
Earlier, analysts noted that Sundial Growers was exhibiting persistent technical weakness with limited evidence of bullish momentum. The latest action not only reinforces that cautious view but highlights that until a decisive break above layered resistance occurs, traders should prepare for continued range-bound conditions and the risk of a volatility spike if support at $1.40 fails.


-
 Afghanistan
-
 Albania
-
 Algeria
-
 Angola
-
 Argentina
-
 Armenia
-
 Australia
-
 Austria
-
 Azerbaijan
-
 Bahamas
-
 Bahrain
-
 Bangladesh
-
 Belarus
-
 Belgium
-
 Bolivia
-
 Botswana
-
 Brazil
-
 Brunei
-
 Bulgaria
-
 Cambodia
-
 Cameroon
-
 Canada
-
 Chile
Chile
-
 China
China
-
 Colombia
-
 Congo
Congo
-
 Costa Rica
-
 Cote d'Ivoire
-
 Croatia
-
 Cuba
Cuba
-
 Cyprus
-
 Czechia
-
 DR Congo
-
 Denmark
-
 Dominican Republic
-
 Ecuador
-
 Egypt
Egypt
-
 El Salvador
-
 Estonia
-
 Eswatini
-
 Ethiopia
-
 Finland
-
 France
-
 Georgia
-
 Germany
-
 Ghana
Ghana
-
 Greece
-
 Haiti
Haiti
-
 Hong Kong
-
 Hungary
-
 India
India
-
 Indonesia
-
 Iran, Islamic republic
-
 Iraq
Iraq
-
 Ireland
-
 Israel
-
 Italy
Italy
-
 Jamaica
-
 Japan
Japan
-
 Jordan
-
 Kazakhstan
-
 Kenya
Kenya
-
 Korea
Korea
-
 Kuwait
-
 Kyrgyzstan
-
 Laos
Laos
-
 Latvia
-
 Lebanon
-
 Lesotho
-
 Libya
Libya
-
 Lithuania
-
 Luxembourg
-
 Madagascar
-
 Malaysia
-
 Malta
Malta
-
 Mauritius
-
 Mexico
-
 Moldova
-
 Mongolia
-
 Montenegro
-
 Morocco
-
 Mozambique
-
 Myanmar
-
 Namibia
-
 Nepal
Nepal
-
 Netherlands
-
 New Zealand
-
 Nigeria
-
 North Macedonia
-
 Norway
-
 Oman
Oman
-
 Pakistan
-
 Palestine
-
 Panama
-
 Papua New Guinea
-
 Paraguay
-
 Peru
Peru
-
 Philippines
-
 Poland
-
 Portugal
-
 Puerto Rico
-
 Qatar
Qatar
-
 Reunion
-
 Romania
-
 Rwanda
-
 Saudi Arabia
-
 Serbia
-
 Singapore
-
 Slovakia
-
 Slovenia
-
 Somalia
-
 South Africa
-
 Spain
Spain
-
 Sri Lanka
-
 Sweden
-
 Switzerland
-
 Syria
Syria
-
 Taiwan
-
 Tajikistan
-
 Tanzania
-
 Thailand
-
 Trinidad and Tobago
-
 Tunisia
-
 Turkey
-
 UAE
UAE
-
 Uganda
-
 Ukraine
-
 United Kingdom
-
United States
-
 Uruguay
-
 Uzbekistan
-
 Venezuela
-
 Vietnam
-
 Yemen
Yemen
-
 Zambia
-
 Zimbabwe
- Forex
- Crypto
