
Q1 net loss of $12.54 billion weighs on MSTR stock with sharp decline

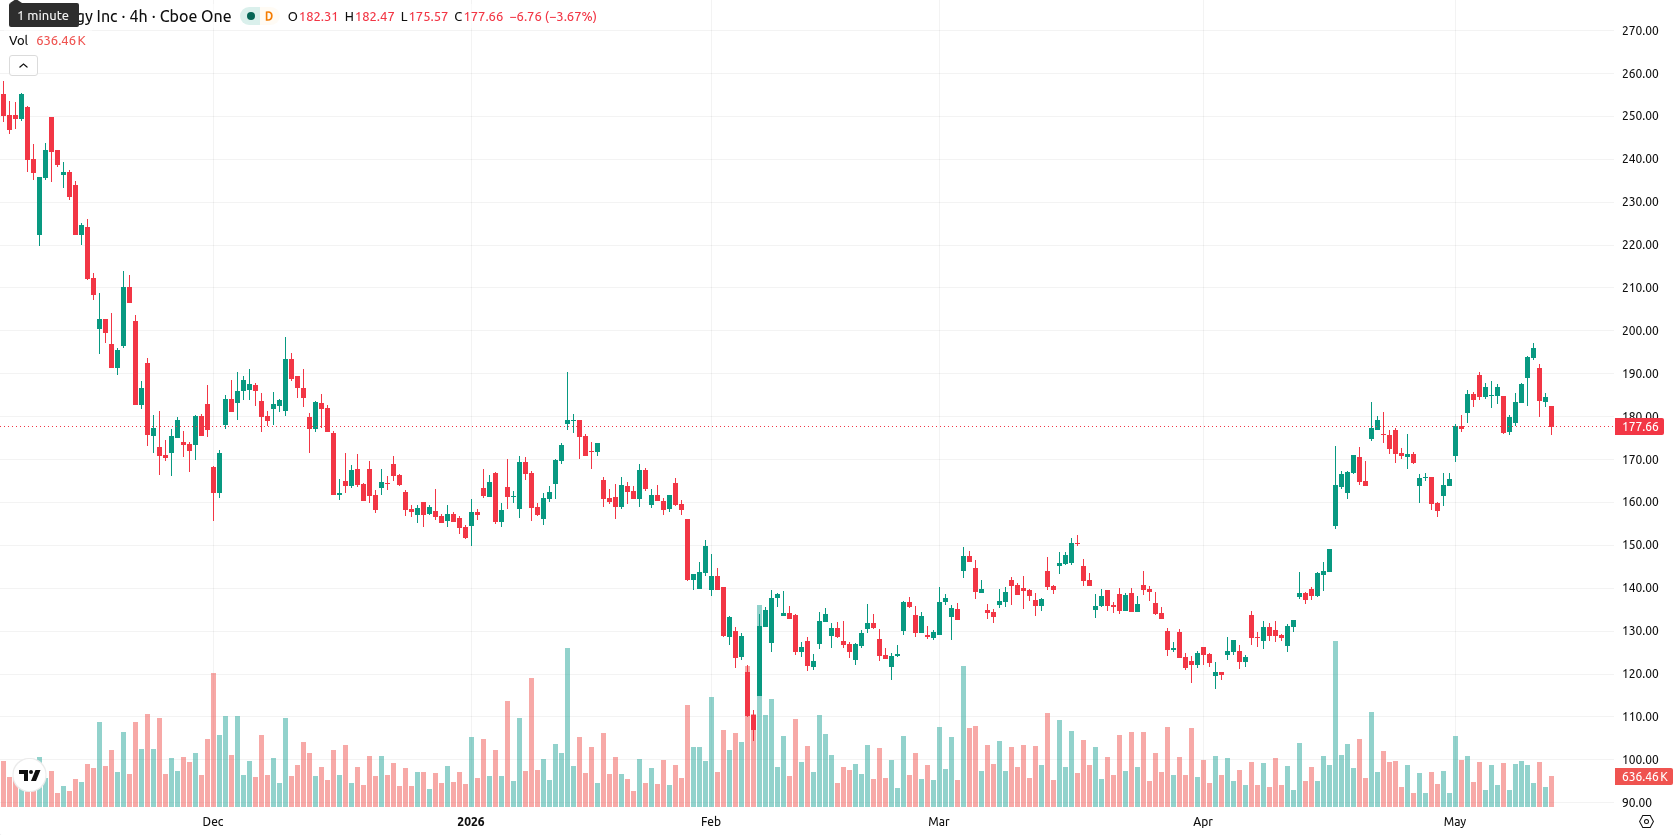
Strategy Incorporated (MSTR, formerly MicroStrategy) is trading at $177.26, marking a daily decline of 3.88%. The stock currently sits above its key short- and medium-term moving averages, while remaining below long-term trend levels.
Highlights
- Jane Street decreased its MSTR position by 78% in Q1 2026, pressuring shares due to large-scale institutional selling.
- MicroStrategy posted a $12.54 billion net loss from realized Bitcoin drawdowns and raised $42.9 million through a stock offering in May.
- Technical signals show mixed momentum; MSTR trades with high volatility and likely consolidates in the $170–$190 range barring additional downside breaks.
Institutional selling and Bitcoin losses weigh as supply climbs
Jane Street reduced its MSTR holdings by 78% during the first quarter of 2026, increasing the available supply of shares and accompanying pressure from institutional divestment. Strategy Inc. reported a $12.54 billion net loss for the first quarter, reflecting realized drawdowns on its large Bitcoin holdings and affecting the company's book value for the period. The firm also raised $42.9 million in net proceeds by issuing 231,324 shares of its Class A common stock in early May, and increased its stock offering capacity by $21.0 billion as of late March. Company leadership has described a new, flexible approach to Bitcoin management, including possible asset sales to meet capital needs, though price action has remained under broader selling pressure.
Mixed momentum with downside bias as supports hold beneath resistance
MSTR is currently supported by the SMA-20 at $172.88 and SMA-50 at $149.67, while the SMA-200 at $221.26 remains an overhead resistance. The Ichimoku Kijun level provides immediate support at $159.07. MACD (D1) remains positive, ADX (D1) signals a modest uptrend, but short-term oscillators indicate mixed momentum, with Stoch RSI strongly oversold and BBP signaling an overbought condition. RSI (D1) maintains a positive bias without being overbought, CCI shows a slight bullish tilt, and the Awesome Oscillator is neutral. Price activity has been volatile within today's $175.74–$182.16 range with a gap-down open and intraday moves weighted to the downside, reflecting near-term weakness.
Limited upside as range trading persists amid weakening buy signals
For the coming week, MSTR will likely consolidate within a typical volatility band between $170 and $190. Given that only one of the weekly signals (MA-50) remains on 'Buy', the probability of a short-term price increase is low, and a further decline may occur. The base scenario is continued range-bound trading, with a sustained break below $170 opening risk to further downside. Conversely, a bullish breakout above $190 would expose the stock to upside targets at subsequent resistance levels.
Previously it was reported that analysts saw elevated downside risks for Strategy Incorporated amid ongoing volatility and a flexible treasury approach centered on large-scale Bitcoin holdings. The recent combination of significant institutional divestment and record net losses underscores persistent selling pressure, making the $170 support level a critical threshold to monitor for potential breakdown or further downside momentum.


-
 Afghanistan
-
 Albania
-
 Algeria
-
 Angola
-
 Argentina
-
 Armenia
-
 Australia
-
 Austria
-
 Azerbaijan
-
 Bahamas
-
 Bahrain
-
 Bangladesh
-
 Belarus
-
 Belgium
-
 Bolivia
-
 Botswana
-
 Brazil
-
 Brunei
-
 Bulgaria
-
 Cambodia
-
 Cameroon
-
 Canada
-
 Chile
Chile
-
 China
China
-
 Colombia
-
 Congo
Congo
-
 Costa Rica
-
 Cote d'Ivoire
-
 Croatia
-
 Cuba
Cuba
-
 Cyprus
-
 Czechia
-
 DR Congo
-
 Denmark
-
 Dominican Republic
-
 Ecuador
-
 Egypt
Egypt
-
 El Salvador
-
 Estonia
-
 Eswatini
-
 Ethiopia
-
 Finland
-
 France
-
 Georgia
-
 Germany
-
 Ghana
Ghana
-
 Greece
-
 Haiti
Haiti
-
 Hong Kong
-
 Hungary
-
 India
India
-
 Indonesia
-
 Iran, Islamic republic
-
 Iraq
Iraq
-
 Ireland
-
 Israel
-
 Italy
Italy
-
 Jamaica
-
 Japan
Japan
-
 Jordan
-
 Kazakhstan
-
 Kenya
Kenya
-
 Korea
Korea
-
 Kuwait
-
 Kyrgyzstan
-
 Laos
Laos
-
 Latvia
-
 Lebanon
-
 Lesotho
-
 Libya
Libya
-
 Lithuania
-
 Luxembourg
-
 Madagascar
-
 Malaysia
-
 Malta
Malta
-
 Mauritius
-
 Mexico
-
 Moldova
-
 Mongolia
-
 Montenegro
-
 Morocco
-
 Mozambique
-
 Myanmar
-
 Namibia
-
 Nepal
Nepal
-
 Netherlands
-
 New Zealand
-
 Nigeria
-
 North Macedonia
-
 Norway
-
 Oman
Oman
-
 Pakistan
-
 Palestine
-
 Panama
-
 Papua New Guinea
-
 Paraguay
-
 Peru
Peru
-
 Philippines
-
 Poland
-
 Portugal
-
 Puerto Rico
-
 Qatar
Qatar
-
 Reunion
-
 Romania
-
 Rwanda
-
 Saudi Arabia
-
 Serbia
-
 Singapore
-
 Slovakia
-
 Slovenia
-
 Somalia
-
 South Africa
-
 Spain
Spain
-
 Sri Lanka
-
 Sweden
-
 Switzerland
-
 Syria
Syria
-
 Taiwan
-
 Tajikistan
-
 Tanzania
-
 Thailand
-
 Trinidad and Tobago
-
 Tunisia
-
 Turkey
-
 UAE
UAE
-
 Uganda
-
 Ukraine
-
 United Kingdom
-
United States
-
 Uruguay
-
 Uzbekistan
-
 Venezuela
-
 Vietnam
-
 Yemen
Yemen
-
 Zambia
-
 Zimbabwe
- Forex
- Crypto
