
Muted session for Nvidia stock as $211.00 support holds

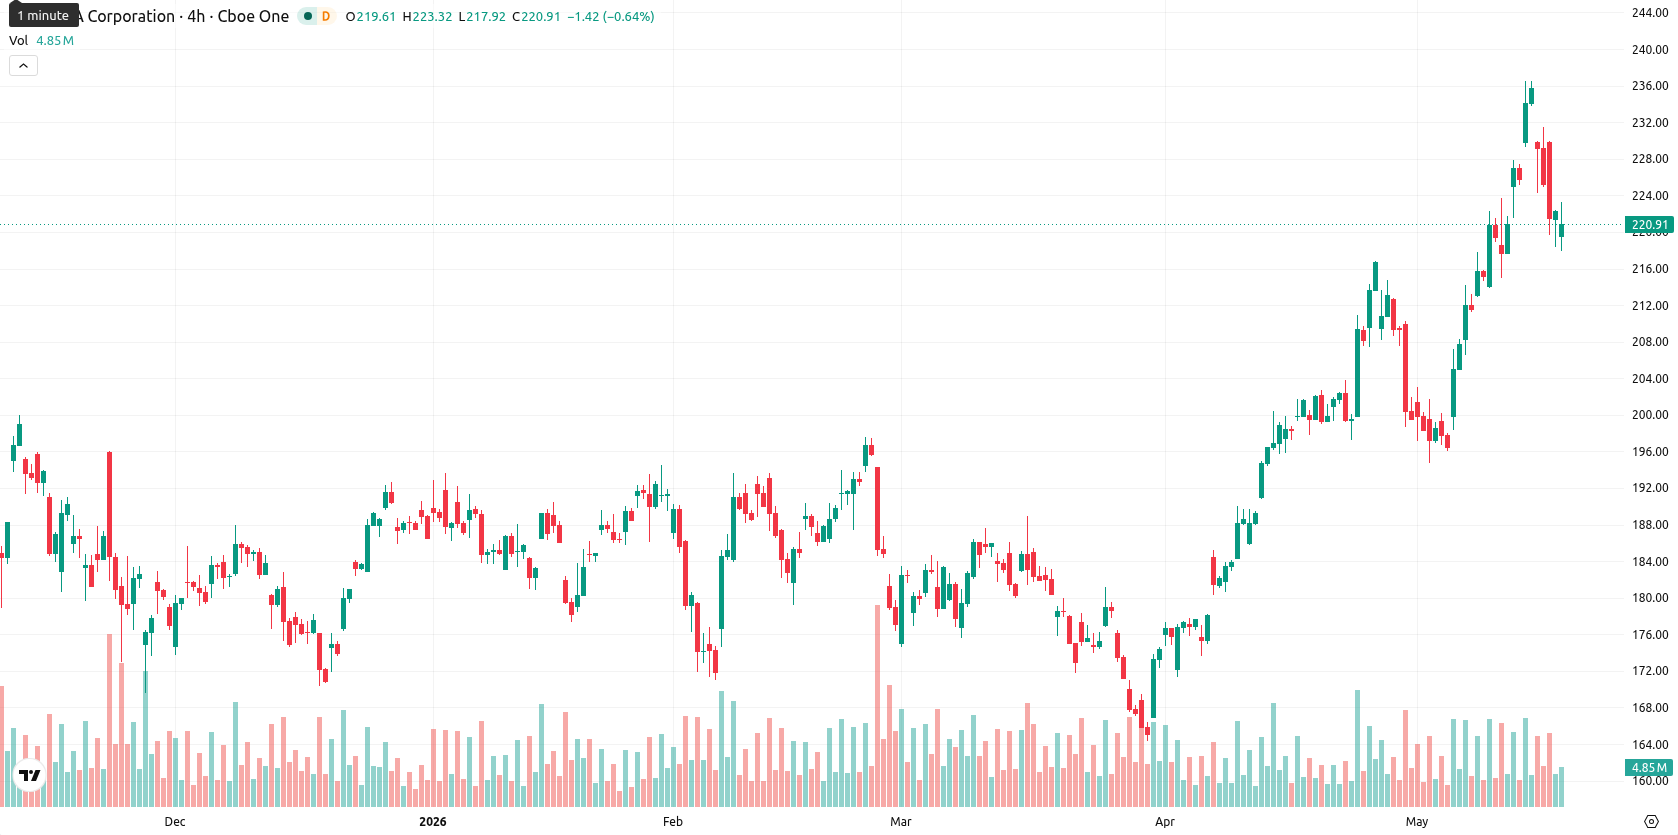
NVIDIA Corporation (NVDA) is trading at $220.66, having slipped 0.60% on the day. The stock remains above its key moving averages, indicating ongoing supportive momentum from recent price action.
Highlights
- US export controls have virtually eliminated Nvidia's market presence in China, resulting in a significant loss of overseas revenue potential.
- Court filings reveal Nvidia GPUs are still entering China via intermediaries, heightening regulatory and compliance risks for the company.
- Bullish technical trends dominate, with trading expected between $218.00 and $225.00 in the next week, though caution prevails after recent selling pressure.
Regulatory escalation as export controls cut China access and margins
Ongoing US export controls have eliminated Nvidia’s market share in China, representing a confirmed loss of access to a critical overseas market. Court documents have revealed that restricted Nvidia GPUs continue to reach China through shell companies, exposing the firm to extended regulatory risks as US authorities deepen enforcement scrutiny. In parallel, a 25% tariff on certain chip exports to China has compounded these operational setbacks by raising costs and diminishing margins for the limited shipments still allowed.
Bullish MACD and overbought signals amid mixed momentum readings
Technically, NVDA is trading above the SMA-20 at $211.26, SMA-50 at $193.95, and SMA-200 at $186.19. The Ichimoku Kijun support is identified at $211.14. Momentum indicators show a bullish MACD on both daily and weekly timeframes, supported by a positive D1 ADX, while ADX on the weekly chart remains neutral. RSI is in bullish territory without being overbought and CCI is positive, but Stoch RSI is neutral, indicating a lack of clear oversold or overbought momentum. Bull/Bear Power (BBP) signals overbought conditions with buyer dominance on D1, whereas shorter timeframes present mixed momentum. Awesome Oscillator remains neutral, offering no strong trend confirmation. There is some divergence between the overbought BBP and otherwise supportive trend indicators.
Range-bound outlook as resistance and support define breakout risks
Over the next five trading days, NVDA is expected to remain within a typical volatility band of $218.00 to $225.00. The baseline scenario anticipates sideways movement in this price corridor. Should resistance at $225.00 be surpassed, the price could break out to new highs above this level. Conversely, if a drop below $218.00 occurs, a more sizable correction toward the Ichimoku Kijun support near $211.00 may follow.
Earlier, analysts noted that Nvidia’s medium- and long-term uptrend remained intact, supported by strong institutional demand despite signs of technical overbought conditions. The current analysis adds a layer of regulatory risk and margin pressure from escalating US export controls, emphasizing the importance of monitoring $225 as a potential breakout threshold or $218 for signals of a corrective move.


-
 Afghanistan
-
 Albania
-
 Algeria
-
 Angola
-
 Argentina
-
 Armenia
-
 Australia
-
 Austria
-
 Azerbaijan
-
 Bahamas
-
 Bahrain
-
 Bangladesh
-
 Belarus
-
 Belgium
-
 Bolivia
-
 Botswana
-
 Brazil
-
 Brunei
-
 Bulgaria
-
 Cambodia
-
 Cameroon
-
 Canada
-
 Chile
Chile
-
 China
China
-
 Colombia
-
 Congo
Congo
-
 Costa Rica
-
 Cote d'Ivoire
-
 Croatia
-
 Cuba
Cuba
-
 Cyprus
-
 Czechia
-
 DR Congo
-
 Denmark
-
 Dominican Republic
-
 Ecuador
-
 Egypt
Egypt
-
 El Salvador
-
 Estonia
-
 Eswatini
-
 Ethiopia
-
 Finland
-
 France
-
 Georgia
-
 Germany
-
 Ghana
Ghana
-
 Greece
-
 Haiti
Haiti
-
 Hong Kong
-
 Hungary
-
 India
India
-
 Indonesia
-
 Iran, Islamic republic
-
 Iraq
Iraq
-
 Ireland
-
 Israel
-
 Italy
Italy
-
 Jamaica
-
 Japan
Japan
-
 Jordan
-
 Kazakhstan
-
 Kenya
Kenya
-
 Korea
Korea
-
 Kuwait
-
 Kyrgyzstan
-
 Laos
Laos
-
 Latvia
-
 Lebanon
-
 Lesotho
-
 Libya
Libya
-
 Lithuania
-
 Luxembourg
-
 Madagascar
-
 Malaysia
-
 Malta
Malta
-
 Mauritius
-
 Mexico
-
 Moldova
-
 Mongolia
-
 Montenegro
-
 Morocco
-
 Mozambique
-
 Myanmar
-
 Namibia
-
 Nepal
Nepal
-
 Netherlands
-
 New Zealand
-
 Nigeria
-
 North Macedonia
-
 Norway
-
 Oman
Oman
-
 Pakistan
-
 Palestine
-
 Panama
-
 Papua New Guinea
-
 Paraguay
-
 Peru
Peru
-
 Philippines
-
 Poland
-
 Portugal
-
 Puerto Rico
-
 Qatar
Qatar
-
 Reunion
-
 Romania
-
 Rwanda
-
 Saudi Arabia
-
 Serbia
-
 Singapore
-
 Slovakia
-
 Slovenia
-
 Somalia
-
 South Africa
-
 Spain
Spain
-
 Sri Lanka
-
 Sweden
-
 Switzerland
-
 Syria
Syria
-
 Taiwan
-
 Tajikistan
-
 Tanzania
-
 Thailand
-
 Trinidad and Tobago
-
 Tunisia
-
 Turkey
-
 UAE
UAE
-
 Uganda
-
 Ukraine
-
 United Kingdom
-
United States
-
 Uruguay
-
 Uzbekistan
-
 Venezuela
-
 Vietnam
-
 Yemen
Yemen
-
 Zambia
-
 Zimbabwe
- Forex
- Crypto
