
Hut 8 stock price forecast: $87.00 support holds as HUT slides 4.67%

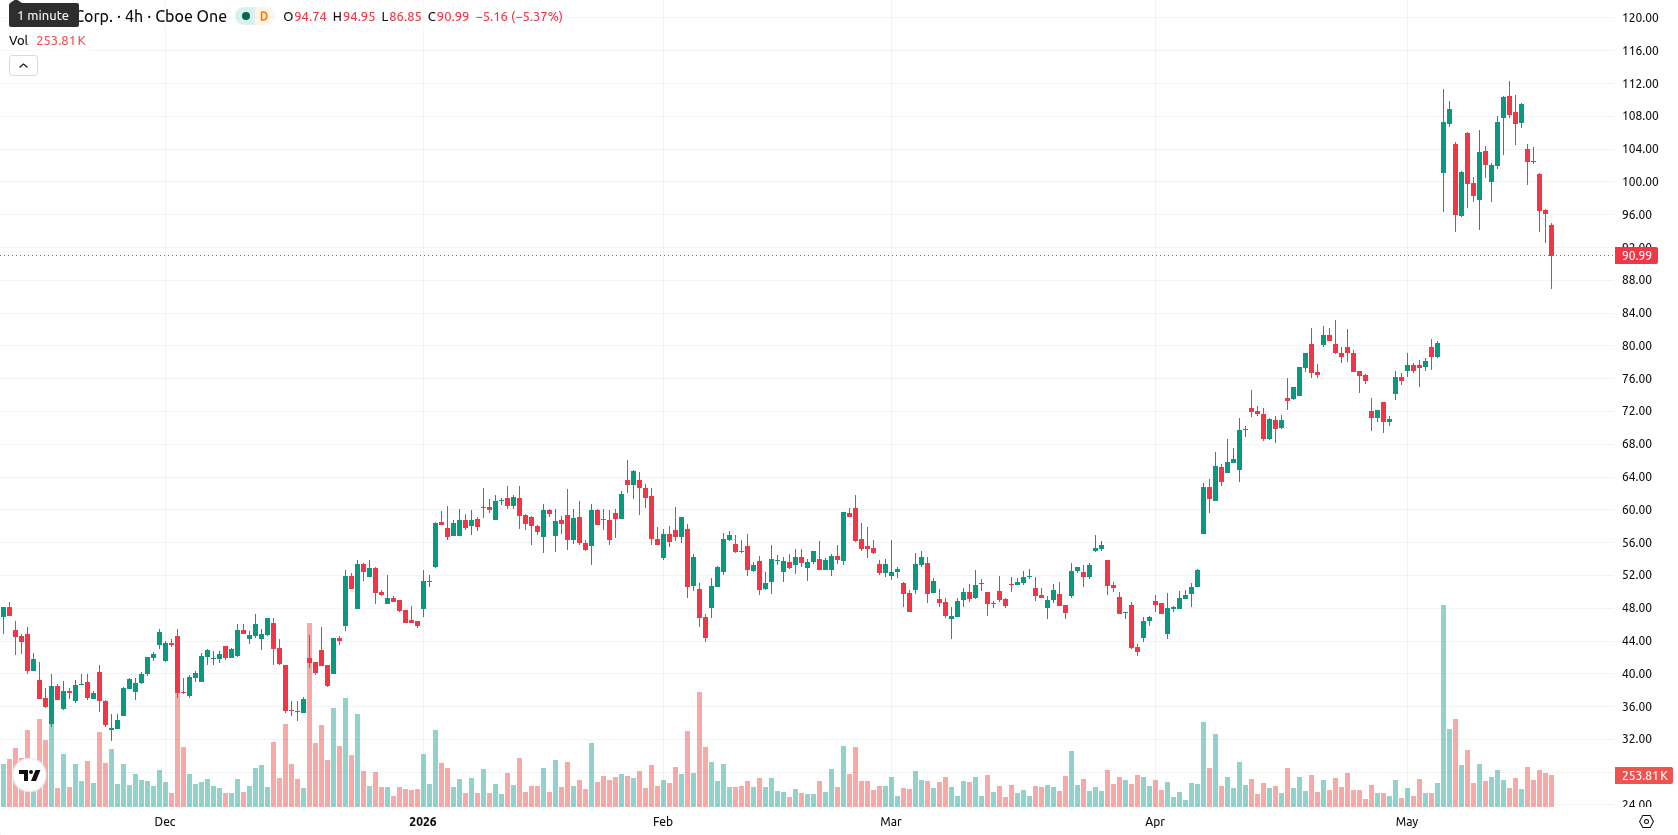
Hut 8 Corp (HUT) is trading at $91.71 after falling 4.67% today. The price remains above its key moving averages, with the session marked by high volatility and pronounced downside momentum during intraday trading.
Highlights
- The asset remains in a strong uptrend, trading above major moving averages with bullish weekly momentum signals dominating.
- Short-term price weakness emerged as the asset dropped 4.67% today, with intraday action showing decisive selling pressure and heightened volatility.
- Expected range for the next five sessions is $87.00–$101.00, with $87.00 as key support and upside breakout likely if above $101.00.
Strong multi-timeframe support as mixed momentum signals diverge
The price remains above the SMA-20 at $88.88, SMA-50 at $68.98, and SMA-200 at $49.42, confirming a strong multi-timeframe support base. Immediate support is defined by the Ichimoku Kijun level at $87.75. The next key support and resistance levels are located near $87.00 and $101.00, respectively. Daily momentum signals remain mixed: MACD and ADX both indicate Buy signals, and the RSI stands at 59, suggesting ongoing strength. However, Stoch RSI flags oversold conditions, CCI is neutral, and the Awesome Oscillator gives no directional bias. BBP readings point to overbought conditions intraday, indicating buyers are still prevalent despite recent selling pressure.
Sideways bias likely as breakout risks shape near-term outlook
For the coming five sessions, HUT is expected to trade within a volatility band of $87.00–$101.00 relative to current levels. The most likely scenario is for price to consolidate sideways between support at $87.00 and resistance at $101.00. If price breaks decisively above $101.00, a new upward leg could develop. Conversely, a sustained move below $87.00 would expose the stock to further downside, although current weekly momentum signals suggest this scenario is less probable.
Earlier, analysts noted that Hut 8 maintained a robust technical position with an overall bullish outlook despite ongoing volatility. The latest price action and persistence above major moving averages reinforce this constructive stance, with the $87.00 support now emerging as the key level to watch for potential shifts in momentum in the sessions ahead.


Latest Hut 8 News


-
 Afghanistan
-
 Albania
-
 Algeria
-
 Angola
-
 Argentina
-
 Armenia
-
 Australia
-
 Austria
-
 Azerbaijan
-
 Bahamas
-
 Bahrain
-
 Bangladesh
-
 Belarus
-
 Belgium
-
 Bolivia
-
 Botswana
-
 Brazil
-
 Brunei
-
 Bulgaria
-
 Cambodia
-
 Cameroon
-
 Canada
-
 Chile
Chile
-
 China
China
-
 Colombia
-
 Congo
Congo
-
 Costa Rica
-
 Cote d'Ivoire
-
 Croatia
-
 Cuba
Cuba
-
 Cyprus
-
 Czechia
-
 DR Congo
-
 Denmark
-
 Dominican Republic
-
 Ecuador
-
 Egypt
Egypt
-
 El Salvador
-
 Estonia
-
 Eswatini
-
 Ethiopia
-
 Finland
-
 France
-
 Georgia
-
 Germany
-
 Ghana
Ghana
-
 Greece
-
 Haiti
Haiti
-
 Hong Kong
-
 Hungary
-
 India
India
-
 Indonesia
-
 Iran, Islamic republic
-
 Iraq
Iraq
-
 Ireland
-
 Israel
-
 Italy
Italy
-
 Jamaica
-
 Japan
Japan
-
 Jordan
-
 Kazakhstan
-
 Kenya
Kenya
-
 Korea
Korea
-
 Kuwait
-
 Kyrgyzstan
-
 Laos
Laos
-
 Latvia
-
 Lebanon
-
 Lesotho
-
 Libya
Libya
-
 Lithuania
-
 Luxembourg
-
 Madagascar
-
 Malaysia
-
 Malta
Malta
-
 Mauritius
-
 Mexico
-
 Moldova
-
 Mongolia
-
 Montenegro
-
 Morocco
-
 Mozambique
-
 Myanmar
-
 Namibia
-
 Nepal
Nepal
-
 Netherlands
-
 New Zealand
-
 Nigeria
-
 North Macedonia
-
 Norway
-
 Oman
Oman
-
 Pakistan
-
 Palestine
-
 Panama
-
 Papua New Guinea
-
 Paraguay
-
 Peru
Peru
-
 Philippines
-
 Poland
-
 Portugal
-
 Puerto Rico
-
 Qatar
Qatar
-
 Reunion
-
 Romania
-
 Rwanda
-
 Saudi Arabia
-
 Serbia
-
 Singapore
-
 Slovakia
-
 Slovenia
-
 Somalia
-
 South Africa
-
 Spain
Spain
-
 Sri Lanka
-
 Sweden
-
 Switzerland
-
 Syria
Syria
-
 Taiwan
-
 Tajikistan
-
 Tanzania
-
 Thailand
-
 Trinidad and Tobago
-
 Tunisia
-
 Turkey
-
 UAE
UAE
-
 Uganda
-
 Ukraine
-
 United Kingdom
-
United States
-
 Uruguay
-
 Uzbekistan
-
 Venezuela
-
 Vietnam
-
 Yemen
Yemen
-
 Zambia
-
 Zimbabwe
- Forex
- Crypto
