
Sundial Growers stock trades down amid prices well below long-term average

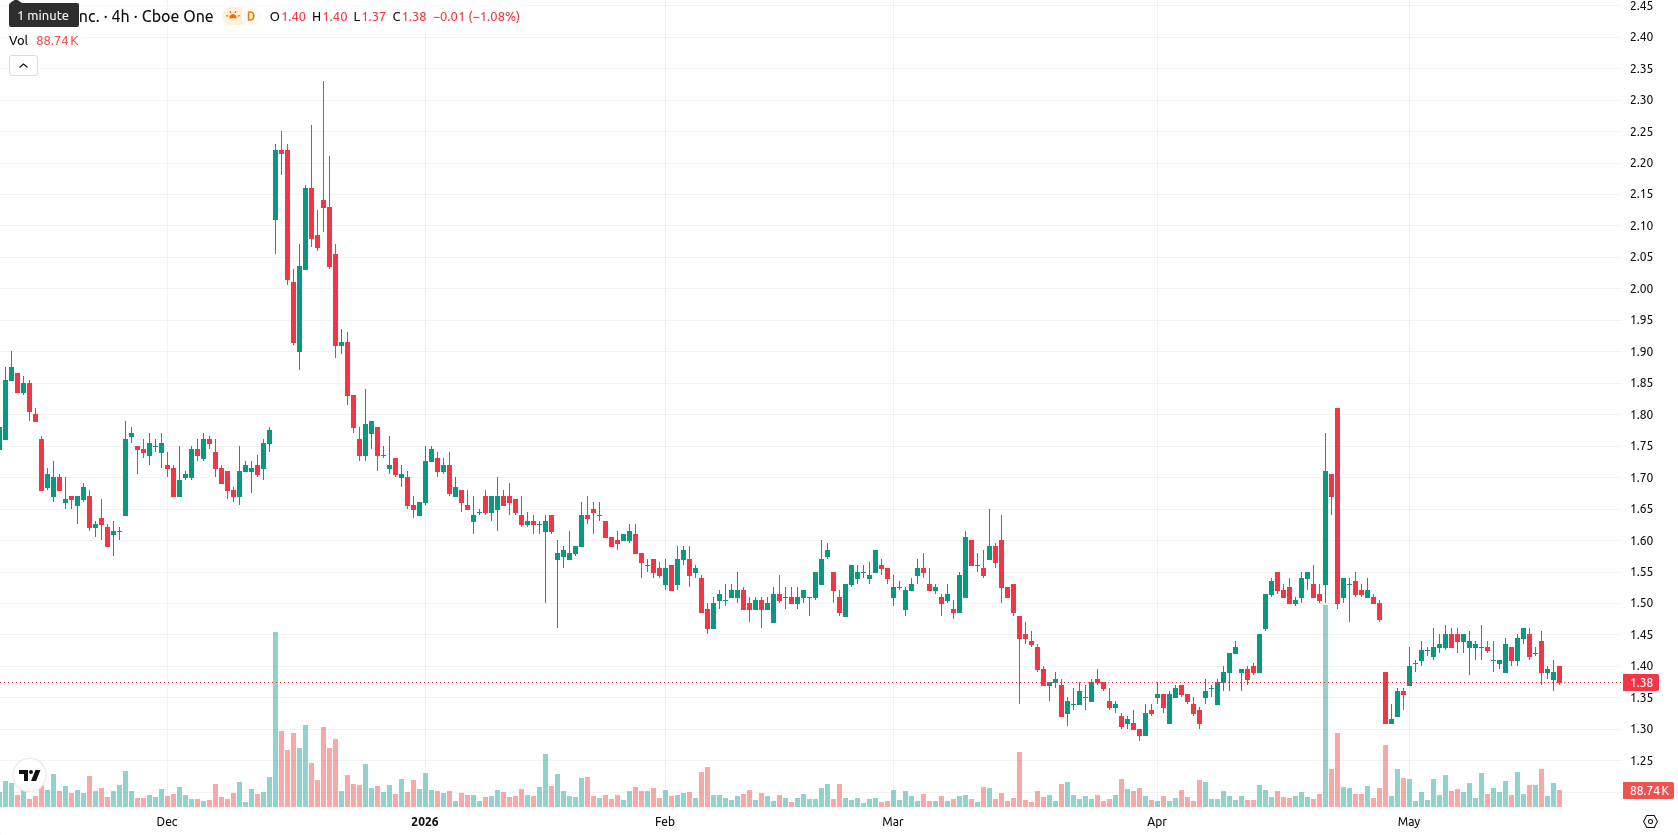
Sundial Growers Inc. (SNDL) is trading at $1.37, down 1.44% on the day, and remains below its key moving averages. The price is positioned under both short- and long-term reference levels, indicating ongoing pressure.
Highlights
- SNDL trades under persistent bearish momentum across short to long-term timeframes, signaling ongoing seller control.
- Key technical support is at $1.32, with immediate resistance at $1.42 and minimal probability of near-term price recovery.
- The stock remains oversold on multiple indicators, projecting a likely sideways to lower trading range of $1.32–$1.42 over the next week.
Sustained technical weakness as major averages and momentum deteriorate
SNDL is trading below the SMA-20 at $1.44, SMA-50 at $1.43, and SMA-200 at $1.82, confirming a sustained technical break lower across all these major averages. The Ichimoku Kijun on the daily chart stands at $1.57, setting immediate resistance above the current price zone. Momentum indicators on D1 remain predominantly negative, with a persistent MACD sell setup and a neutral ADX at low levels, pointing to a weak directional trend. Oscillators show signs of exhaustion among sellers, with the RSI at 43, CCI at -80, and Stoch RSI deeply oversold at 3.3, although none confirm a reversal. BBP remains negative, reflecting intraday seller control, and the Awesome Oscillator continues to reinforce the downside bias.
Range-bound outlook as bearish indicators limit near-term upside
In the near term, SNDL is expected to trade within a typical volatility band of $1.32 to $1.42, reflecting recent price action and prevailing technical pressure. The probability of a price increase remains very low, less than 20%, based on the dominance of bearish indicators across daily and weekly timeframes. Pricing is likely to consolidate near oversold levels as the baseline scenario. Upside relief would require a decisive breakout above $1.42, while renewed downward momentum could be triggered by a break below $1.32.
Earlier, analysts noted that Sundial Growers was exhibiting persistent technical weakness with limited prospects for a near-term rebound. Current market action reinforces this bearish outlook, with traders advised to closely monitor the $1.32 level as a potential trigger for renewed downside if market pressure intensifies.


-
 Afghanistan
-
 Albania
-
 Algeria
-
 Angola
-
 Argentina
-
 Armenia
-
 Australia
-
 Austria
-
 Azerbaijan
-
 Bahamas
-
 Bahrain
-
 Bangladesh
-
 Belarus
-
 Belgium
-
 Bolivia
-
 Botswana
-
 Brazil
-
 Brunei
-
 Bulgaria
-
 Cambodia
-
 Cameroon
-
 Canada
-
 Chile
Chile
-
 China
China
-
 Colombia
-
 Congo
Congo
-
 Costa Rica
-
 Cote d'Ivoire
-
 Croatia
-
 Cuba
Cuba
-
 Cyprus
-
 Czechia
-
 DR Congo
-
 Denmark
-
 Dominican Republic
-
 Ecuador
-
 Egypt
Egypt
-
 El Salvador
-
 Estonia
-
 Eswatini
-
 Ethiopia
-
 Finland
-
 France
-
 Georgia
-
 Germany
-
 Ghana
Ghana
-
 Greece
-
 Haiti
Haiti
-
 Hong Kong
-
 Hungary
-
 India
India
-
 Indonesia
-
 Iran, Islamic republic
-
 Iraq
Iraq
-
 Ireland
-
 Israel
-
 Italy
Italy
-
 Jamaica
-
 Japan
Japan
-
 Jordan
-
 Kazakhstan
-
 Kenya
Kenya
-
 Korea
Korea
-
 Kuwait
-
 Kyrgyzstan
-
 Laos
Laos
-
 Latvia
-
 Lebanon
-
 Lesotho
-
 Libya
Libya
-
 Lithuania
-
 Luxembourg
-
 Madagascar
-
 Malaysia
-
 Malta
Malta
-
 Mauritius
-
 Mexico
-
 Moldova
-
 Mongolia
-
 Montenegro
-
 Morocco
-
 Mozambique
-
 Myanmar
-
 Namibia
-
 Nepal
Nepal
-
 Netherlands
-
 New Zealand
-
 Nigeria
-
 North Macedonia
-
 Norway
-
 Oman
Oman
-
 Pakistan
-
 Palestine
-
 Panama
-
 Papua New Guinea
-
 Paraguay
-
 Peru
Peru
-
 Philippines
-
 Poland
-
 Portugal
-
 Puerto Rico
-
 Qatar
Qatar
-
 Reunion
-
 Romania
-
 Rwanda
-
 Saudi Arabia
-
 Serbia
-
 Singapore
-
 Slovakia
-
 Slovenia
-
 Somalia
-
 South Africa
-
 Spain
Spain
-
 Sri Lanka
-
 Sweden
-
 Switzerland
-
 Syria
Syria
-
 Taiwan
-
 Tajikistan
-
 Tanzania
-
 Thailand
-
 Trinidad and Tobago
-
 Tunisia
-
 Turkey
-
 UAE
UAE
-
 Uganda
-
 Ukraine
-
 United Kingdom
-
United States
-
 Uruguay
-
 Uzbekistan
-
 Venezuela
-
 Vietnam
-
 Yemen
Yemen
-
 Zambia
-
 Zimbabwe
- Forex
- Crypto
