
+1.74% for Sundial Growers stock as buyers and sellers diverge in short-term moves

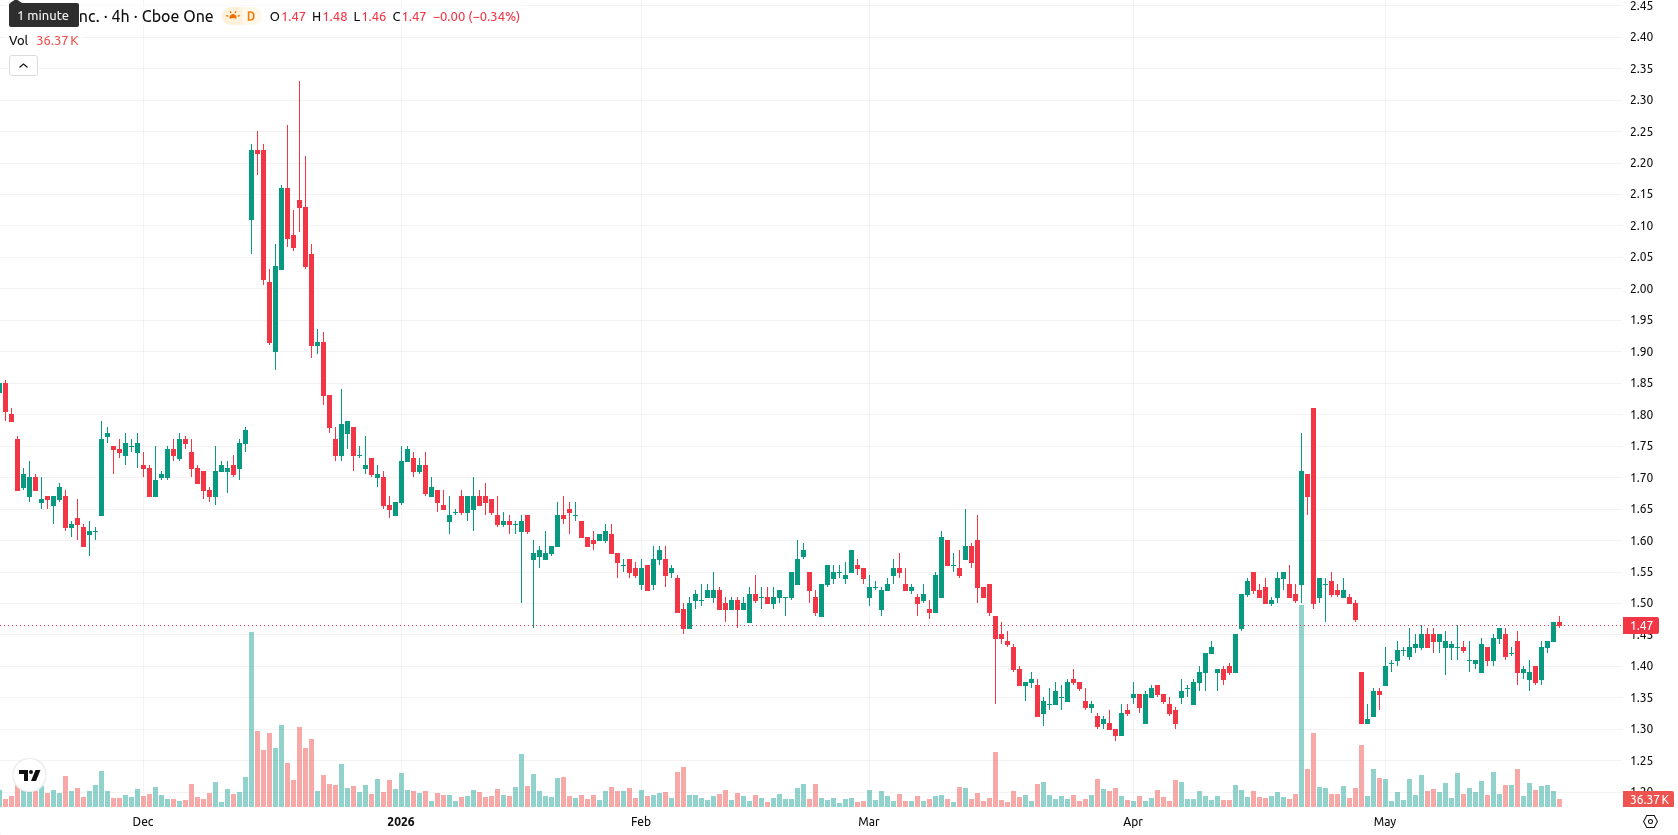
Sundial Growers Inc. (SNDL) stock is trading at $1.47, gaining 1.74% on the day. The price sits above its key short- and medium-term moving averages, reflecting persistent intraday strength.
Highlights
- SNDL shows short- and medium-term bullish momentum but remains in a longer-term bearish trend below major resistance.
- Technical indicators are mixed, with some overbought conditions and weak trend conviction, causing a divergence in signals.
- SNDL is likely to remain rangebound between $1.43 and $1.54 over the next five days, with less than 20% chance of a sustained move higher.
Oscillator divergence emerges as chart resistance limits upward moves
SNDL is trading above the MA-20 ($1.43) and MA-50 ($1.42) but remains below the longer-term MA-200 ($1.82), while the Ichimoku Kijun level at $1.57 acts as the nearest resistance. The MACD on both daily and weekly timeframes continues to show strong bearish momentum, whereas the ADX is neutral and subdued, highlighting weak overall trend conviction. RSI is just above 53, pointing to moderate buying pressure, while Stoch RSI remains deeply overbought and CCI is signaling bullish conditions—indicating notable divergence across oscillators. The BBP is positive and classified as "Buy," suggesting buyers currently dominate, but the Awesome Oscillator reads neutral, not reinforcing the prevailing short-term move.
Sideways trading expected as range-bound bias persists
Over the coming five sessions, SNDL's expected range is $1.43–$1.54, with typical volatility staying within a 7% band. The base case is for continued sideways trading between immediate support at $1.43 and resistance at $1.57. A close above $1.57 could drive a test of higher resistance, while a break below $1.43 may trigger renewed downside toward the next support zone, given the overall cautious bias signaled by weekly indicators.
Earlier, analysts noted that Sundial Growers was exhibiting short- to medium-term technical resilience within a broader context of cautious sentiment and emerging overbought signals. The current outlook reinforces this mixed setup, so traders should monitor for a decisive move above $1.57 as confirmation of renewed directional momentum.


-
 Afghanistan
-
 Albania
-
 Algeria
-
 Angola
-
 Argentina
-
 Armenia
-
 Australia
-
 Austria
-
 Azerbaijan
-
 Bahamas
-
 Bahrain
-
 Bangladesh
-
 Belarus
-
 Belgium
-
 Bolivia
-
 Botswana
-
 Brazil
-
 Brunei
-
 Bulgaria
-
 Cambodia
-
 Cameroon
-
 Canada
-
 Chile
Chile
-
 China
China
-
 Colombia
-
 Congo
Congo
-
 Costa Rica
-
 Cote d'Ivoire
-
 Croatia
-
 Cuba
Cuba
-
 Cyprus
-
 Czechia
-
 DR Congo
-
 Denmark
-
 Dominican Republic
-
 Ecuador
-
 Egypt
Egypt
-
 El Salvador
-
 Estonia
-
 Eswatini
-
 Ethiopia
-
 Finland
-
 France
-
 Georgia
-
 Germany
-
 Ghana
Ghana
-
 Greece
-
 Haiti
Haiti
-
 Hong Kong
-
 Hungary
-
 India
India
-
 Indonesia
-
 Iran, Islamic republic
-
 Iraq
Iraq
-
 Ireland
-
 Israel
-
 Italy
Italy
-
 Jamaica
-
 Japan
Japan
-
 Jordan
-
 Kazakhstan
-
 Kenya
Kenya
-
 Korea
Korea
-
 Kuwait
-
 Kyrgyzstan
-
 Laos
Laos
-
 Latvia
-
 Lebanon
-
 Lesotho
-
 Libya
Libya
-
 Lithuania
-
 Luxembourg
-
 Madagascar
-
 Malaysia
-
 Malta
Malta
-
 Mauritius
-
 Mexico
-
 Moldova
-
 Mongolia
-
 Montenegro
-
 Morocco
-
 Mozambique
-
 Myanmar
-
 Namibia
-
 Nepal
Nepal
-
 Netherlands
-
 New Zealand
-
 Nigeria
-
 North Macedonia
-
 Norway
-
 Oman
Oman
-
 Pakistan
-
 Palestine
-
 Panama
-
 Papua New Guinea
-
 Paraguay
-
 Peru
Peru
-
 Philippines
-
 Poland
-
 Portugal
-
 Puerto Rico
-
 Qatar
Qatar
-
 Reunion
-
 Romania
-
 Rwanda
-
 Saudi Arabia
-
 Serbia
-
 Singapore
-
 Slovakia
-
 Slovenia
-
 Somalia
-
 South Africa
-
 Spain
Spain
-
 Sri Lanka
-
 Sweden
-
 Switzerland
-
 Syria
Syria
-
 Taiwan
-
 Tajikistan
-
 Tanzania
-
 Thailand
-
 Trinidad and Tobago
-
 Tunisia
-
 Turkey
-
 UAE
UAE
-
 Uganda
-
 Ukraine
-
 United Kingdom
-
United States
-
 Uruguay
-
 Uzbekistan
-
 Venezuela
-
 Vietnam
-
 Yemen
Yemen
-
 Zambia
-
 Zimbabwe
- Forex
- Crypto
