
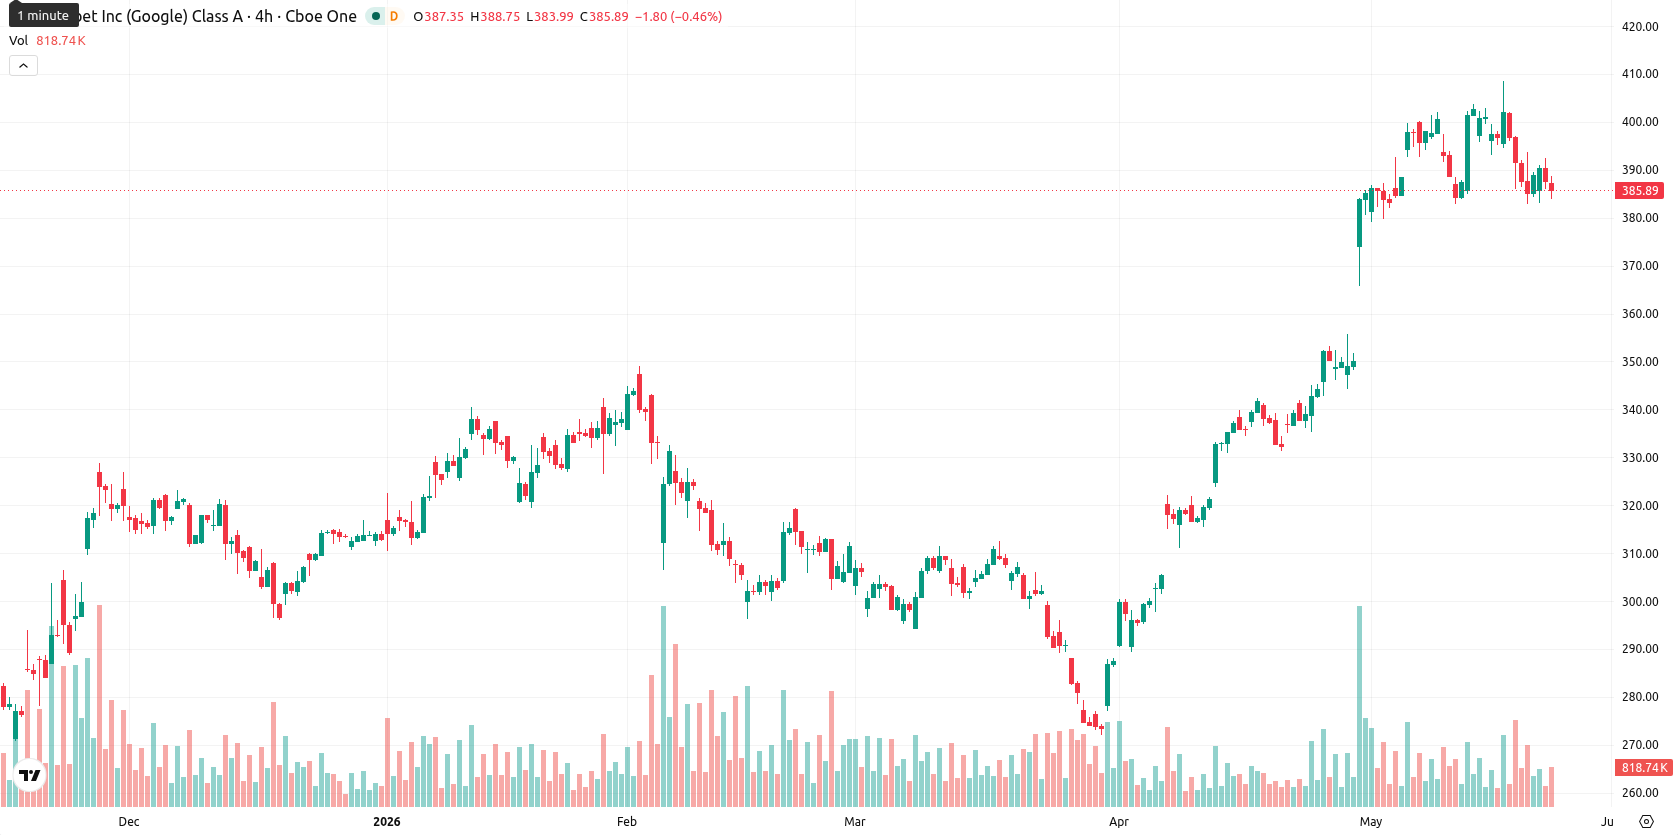
$377–$395 range contains Alphabet stock price movement

Alphabet Inc. (GOOGL) stock is trading at $385.95, down 0.38% on the day. The price remains positioned above its key short- and long-term moving averages, signaling sustained upward momentum in the broader trend.
Highlights
- Alphabet faces escalating regulatory actions and legal challenges targeting its dominant digital advertising business, increasing compliance risks and costs.
- Intensified oversight from multiple authorities introduces ongoing operational uncertainty, although share price remains pressured amid broader market weakness.
- GOOGL is consolidating between support at $377.00 and resistance at $395.00, with strong bullish technical momentum and over 80% probability of a price increase next week.
Regulatory and legal pressure intensifies as compliance risks mount
Alphabet has been subject to growing regulatory scrutiny in multiple jurisdictions, with recent disputes underscoring the intensified efforts by authorities to impose tighter controls over its digital advertising business. The escalation of legislative and legal challenges specifically targets the company's dominance in advertising platforms, introducing new layers of legal and operational risk. These developments have raised compliance costs and uncertainty surrounding ongoing business practices, though price action has remained under broader selling pressure.
Strong bullish bias holds as momentum signals diverge
GOOGL currently trades above the SMA-20 at $383.43, which provides short-term support, and is well above both the SMA-50 at $339.50 and SMA-200 at $295.24, confirming a strong bullish bias across all major moving averages. The Ichimoku Kijun sits at $369.98, further reinforcing immediate support below the market, while price action today hovered near the midpoint of the daily range. On the daily chart, MACD and ADX both signal persistent upward momentum. However, the oscillators show mixed readings: the RSI prints a bullish 61.53, the Stoch RSI has moved into oversold territory, and the CCI is neutral, while the BBP indicates overbought conditions and the Awesome Oscillator does not confirm a clear directional trend. Volatility during the session has been moderate, reflecting a period of sideways consolidation.
Upside favored amid consolidation and technical breakout risks
For the coming week, the price is expected to fluctuate within a typical volatility band between $377.00 and $395.00, keeping the current level of $385.95 nearly in the middle of this range. The probability of a price increase is assessed as very high, with more than an 80% chance of an upward move. The baseline scenario points toward continued consolidation within this range, while a technical breakout above $390 could lead to a test of resistance at $395. Conversely, a move below the $377 support would challenge the prevailing uptrend and increase the risk of further downside.
Earlier, analysts noted that Alphabet’s technical setup and AI-focused partnerships were positioning the stock for continued resilience despite mixed institutional flows. With regulatory pressures now intensifying and volatility remaining contained, watch for any breakout above the $390 level as a signal that bullish momentum is eclipsing recent legal risks.


Latest Google News


-
 Afghanistan
-
 Albania
-
 Algeria
-
 Angola
-
 Argentina
-
 Armenia
-
 Australia
-
 Austria
-
 Azerbaijan
-
 Bahamas
-
 Bahrain
-
 Bangladesh
-
 Belarus
-
 Belgium
-
 Bolivia
-
 Botswana
-
 Brazil
-
 Brunei
-
 Bulgaria
-
 Cambodia
-
 Cameroon
-
 Canada
-
 Chile
Chile
-
 China
China
-
 Colombia
-
 Congo
Congo
-
 Costa Rica
-
 Cote d'Ivoire
-
 Croatia
-
 Cuba
Cuba
-
 Cyprus
-
 Czechia
-
 DR Congo
-
 Denmark
-
 Dominican Republic
-
 Ecuador
-
 Egypt
Egypt
-
 El Salvador
-
 Estonia
-
 Eswatini
-
 Ethiopia
-
 Finland
-
 France
-
 Georgia
-
 Germany
-
 Ghana
Ghana
-
 Greece
-
 Haiti
Haiti
-
 Hong Kong
-
 Hungary
-
 India
India
-
 Indonesia
-
 Iran, Islamic republic
-
 Iraq
Iraq
-
 Ireland
-
 Israel
-
 Italy
Italy
-
 Jamaica
-
 Japan
Japan
-
 Jordan
-
 Kazakhstan
-
 Kenya
Kenya
-
 Korea
Korea
-
 Kuwait
-
 Kyrgyzstan
-
 Laos
Laos
-
 Latvia
-
 Lebanon
-
 Lesotho
-
 Libya
Libya
-
 Lithuania
-
 Luxembourg
-
 Madagascar
-
 Malaysia
-
 Malta
Malta
-
 Mauritius
-
 Mexico
-
 Moldova
-
 Mongolia
-
 Montenegro
-
 Morocco
-
 Mozambique
-
 Myanmar
-
 Namibia
-
 Nepal
Nepal
-
 Netherlands
-
 New Zealand
-
 Nigeria
-
 North Macedonia
-
 Norway
-
 Oman
Oman
-
 Pakistan
-
 Palestine
-
 Panama
-
 Papua New Guinea
-
 Paraguay
-
 Peru
Peru
-
 Philippines
-
 Poland
-
 Portugal
-
 Puerto Rico
-
 Qatar
Qatar
-
 Reunion
-
 Romania
-
 Rwanda
-
 Saudi Arabia
-
 Serbia
-
 Singapore
-
 Slovakia
-
 Slovenia
-
 Somalia
-
 South Africa
-
 Spain
Spain
-
 Sri Lanka
-
 Sweden
-
 Switzerland
-
 Syria
Syria
-
 Taiwan
-
 Tajikistan
-
 Tanzania
-
 Thailand
-
 Trinidad and Tobago
-
 Tunisia
-
 Turkey
-
 UAE
UAE
-
 Uganda
-
 Ukraine
-
 United Kingdom
-
United States
-
 Uruguay
-
 Uzbekistan
-
 Venezuela
-
 Vietnam
-
 Yemen
Yemen
-
 Zambia
-
 Zimbabwe
- Forex
- Crypto
