
Persistent selling pressure pushes Sundial Growers stock lower in current trading

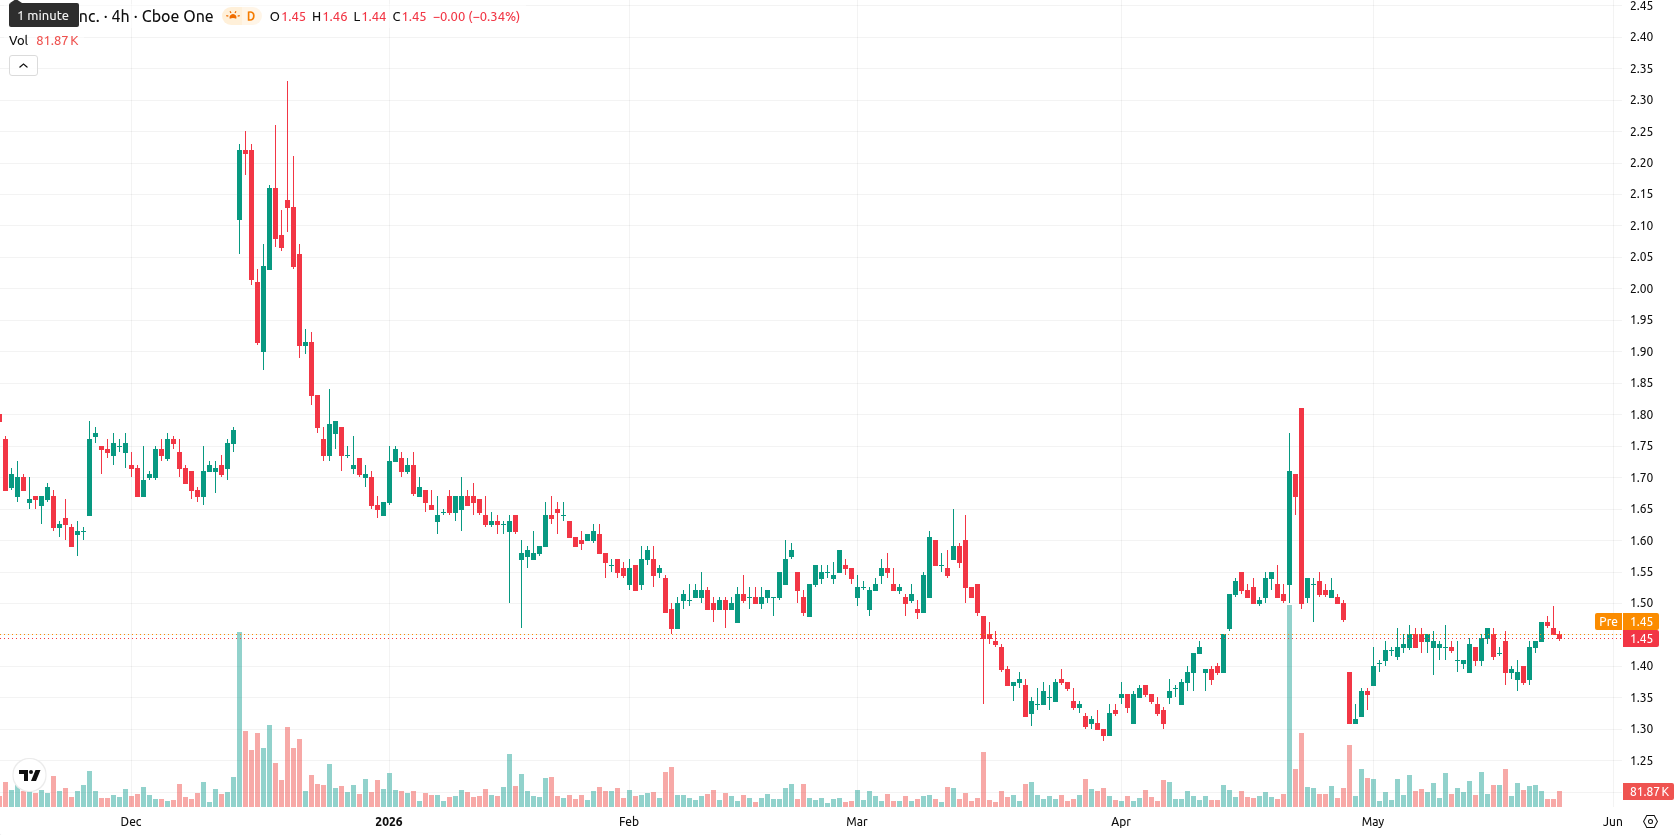
Sundial Growers Inc. (SNDL) stock is trading at $1.45, marking a daily decline of 1.70%. Shares are positioned just above their key short- and medium-term moving averages, but remain well below the long-term trend.
Highlights
- SNDL exhibits short-term bullish momentum above key moving averages but remains under persistent long-term downward pressure.
- Indicators suggest consolidation within a $1.32 to $1.52 range, with a bearish bias and low probability of a significant upside move.
- A break above $1.57 would signal bullish potential toward $1.60, while a drop below $1.32 increases downside risk to $1.25 or lower.
Tight support and mixed momentum as indicators cap upside
The MA-20 at $1.43 and MA-50 at $1.42 are providing a narrow support band near the current price, while the MA-200 remains significantly higher at $1.82. The Ichimoku Kijun on the daily timeframe stands at $1.57, functioning as immediate resistance just above. MACD on the daily chart is generating a strong sell signal, with the ADX showing neutral trend strength. The daily RSI reads at 51 for a mildly bullish stance, but both Stoch RSI and CCI markers indicate overbought-to-neutral conditions that can limit upside. Bull/Bear Power points to marginal buyer dominance intraday, but the Awesome Oscillator is neutral. SNDL opened the session with a small upward gap but has since hovered near the day's low of $1.44, reflecting low to moderate volatility and persistent seller pressure.
Range-bound outlook as resistance constrains upward reversal
Over the next five trading days, SNDL is expected to fluctuate within a range of $1.32 to $1.52, representing a typical volatility band relative to current levels. There is a low probability of a move above $1.52; any sustained advance would need a breakout beyond the $1.57 resistance, which could clear a path toward $1.60. If the stock closes decisively under $1.32, accelerated downward momentum could push toward $1.25 or below, while the base case calls for continued range-bound action.
Earlier, analysts noted that Sundial Growers displayed a mixed technical picture with short-term resilience but ongoing vulnerability to downside risks. The latest analysis reinforces this cautious outlook, highlighting that a decisive move beneath $1.32 could trigger renewed selling pressure, making this level a critical threshold for traders to monitor in the days ahead.


-
 Afghanistan
-
 Albania
-
 Algeria
-
 Angola
-
 Argentina
-
 Armenia
-
 Australia
-
 Austria
-
 Azerbaijan
-
 Bahamas
-
 Bahrain
-
 Bangladesh
-
 Belarus
-
 Belgium
-
 Bolivia
-
 Botswana
-
 Brazil
-
 Brunei
-
 Bulgaria
-
 Cambodia
-
 Cameroon
-
 Canada
-
 Chile
Chile
-
 China
China
-
 Colombia
-
 Congo
Congo
-
 Costa Rica
-
 Cote d'Ivoire
-
 Croatia
-
 Cuba
Cuba
-
 Cyprus
-
 Czechia
-
 DR Congo
-
 Denmark
-
 Dominican Republic
-
 Ecuador
-
 Egypt
Egypt
-
 El Salvador
-
 Estonia
-
 Eswatini
-
 Ethiopia
-
 Finland
-
 France
-
 Georgia
-
 Germany
-
 Ghana
Ghana
-
 Greece
-
 Haiti
Haiti
-
 Hong Kong
-
 Hungary
-
 India
India
-
 Indonesia
-
 Iran, Islamic republic
-
 Iraq
Iraq
-
 Ireland
-
 Israel
-
 Italy
Italy
-
 Jamaica
-
 Japan
Japan
-
 Jordan
-
 Kazakhstan
-
 Kenya
Kenya
-
 Korea
Korea
-
 Kuwait
-
 Kyrgyzstan
-
 Laos
Laos
-
 Latvia
-
 Lebanon
-
 Lesotho
-
 Libya
Libya
-
 Lithuania
-
 Luxembourg
-
 Madagascar
-
 Malaysia
-
 Malta
Malta
-
 Mauritius
-
 Mexico
-
 Moldova
-
 Mongolia
-
 Montenegro
-
 Morocco
-
 Mozambique
-
 Myanmar
-
 Namibia
-
 Nepal
Nepal
-
 Netherlands
-
 New Zealand
-
 Nigeria
-
 North Macedonia
-
 Norway
-
 Oman
Oman
-
 Pakistan
-
 Palestine
-
 Panama
-
 Papua New Guinea
-
 Paraguay
-
 Peru
Peru
-
 Philippines
-
 Poland
-
 Portugal
-
 Puerto Rico
-
 Qatar
Qatar
-
 Reunion
-
 Romania
-
 Rwanda
-
 Saudi Arabia
-
 Serbia
-
 Singapore
-
 Slovakia
-
 Slovenia
-
 Somalia
-
 South Africa
-
 Spain
Spain
-
 Sri Lanka
-
 Sweden
-
 Switzerland
-
 Syria
Syria
-
 Taiwan
-
 Tajikistan
-
 Tanzania
-
 Thailand
-
 Trinidad and Tobago
-
 Tunisia
-
 Turkey
-
 UAE
UAE
-
 Uganda
-
 Ukraine
-
 United Kingdom
-
United States
-
 Uruguay
-
 Uzbekistan
-
 Venezuela
-
 Vietnam
-
 Yemen
Yemen
-
 Zambia
-
 Zimbabwe
- Forex
- Crypto
