
Texas Instruments stock price forecast: $343 resistance in focus as TXN advances 5.18%

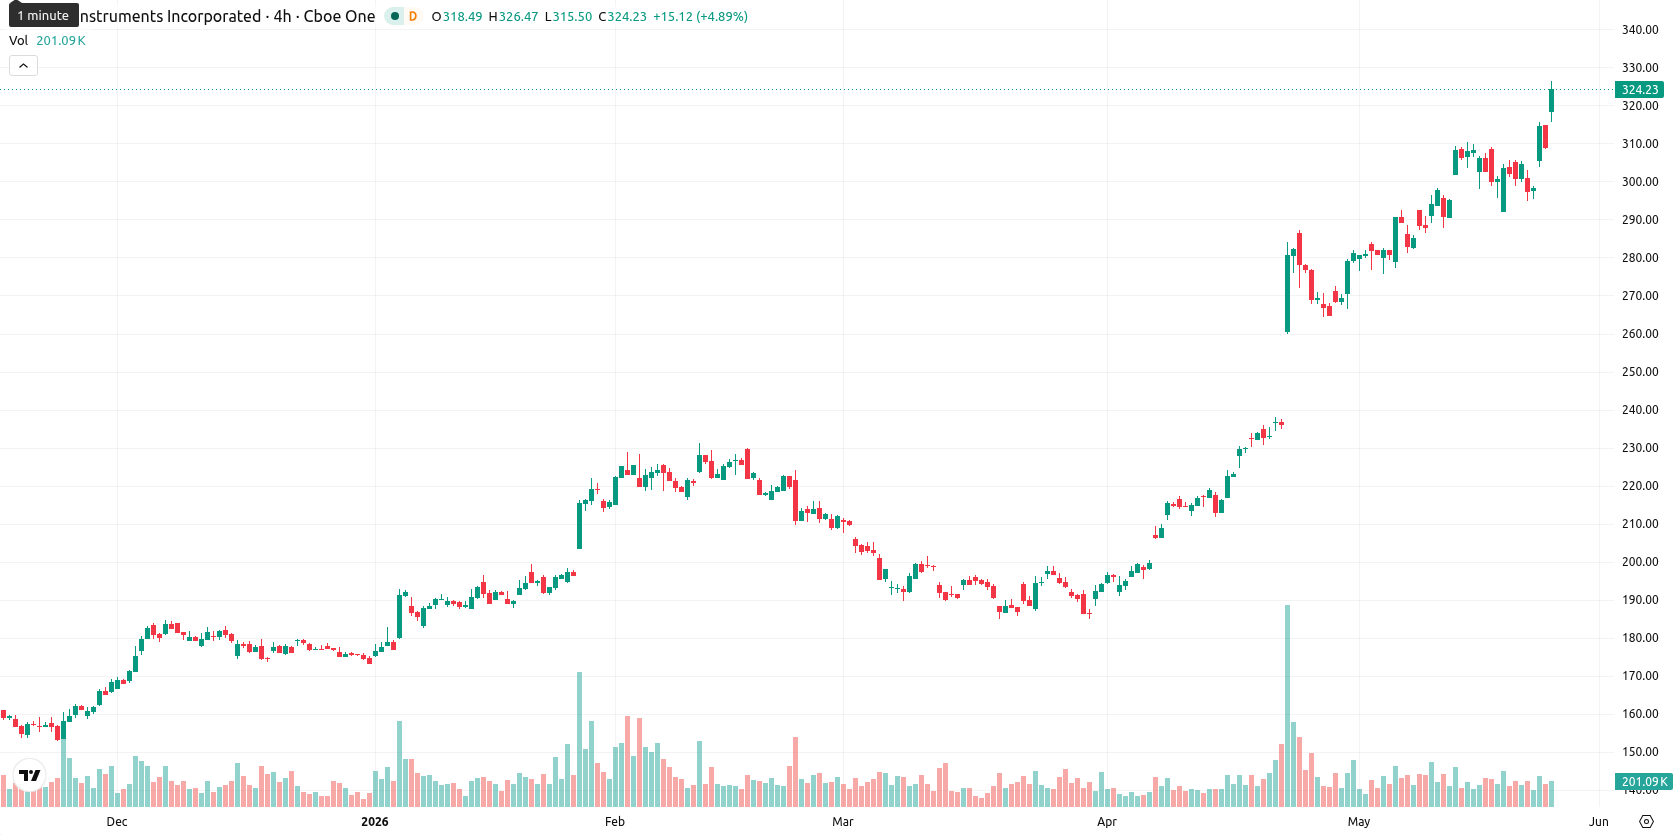
Texas Instruments Incorporated (TXN) stock is trading at $325.66, up 5.18% on the day. The price is well above its key moving averages, reflecting notable upward momentum in the current session.
Highlights
- TXN trades in a strong bullish trend, well above key moving averages across all timeframes.
- Momentum and directional signals remain decisively bullish, although several oscillators indicate an overbought market, warranting caution.
- Expected trading range for the next five days is $307.00 to $343.00, with high probability of continued upward movement barring a break below $307.00 support.
Momentum remains strong as price challenges overbought signals
TXN is currently trading decisively above the SMA-20 at $290.81, SMA-50 at $242.05, and SMA-200 at $200.73. The Ichimoku Kijun at $270.62 sets immediate technical support, with price action holding well above this line. The latest session opened with a marked gap higher from $309.63 to $317.09, and the current range spans $316.08 to $326.02, indicating increased short-term volatility and persistent buying pressure near session highs. Momentum remains robust: the MACD signals a strong buy, the ADX reads 44.66 (powerful trend strength), and bullish readings dominate across the RSI (71.94, bordering overbought), CCI (119.35, overbought), and Stoch RSI (strong buy with intraday overbought prints). BBP signals deep buyer control, while the Awesome Oscillator is neutral, tempering the overall bullish setup modestly. Oscillator overbought signals call for some caution despite persistent upward momentum.
Consolidation outlook as support and resistance guide near-term range
Over the coming five trading days, TXN is expected to trade within a range of $307.00 to $343.00, reflecting the typical volatility band relative to current levels. The base scenario anticipates consolidation between support and resistance as the most probable path, supported by consensus bullish signals from weekly RSI, ADX, MACD, and MA-50. A definitive breakout above $343.00 could trigger further upside momentum, while a loss of support near $307.00 would risk a short-term pullback, though underlying trends remain constructive.
Earlier, analysts noted that Texas Instruments was exhibiting strong bullish momentum, driven by expanding demand and increased institutional interest. The latest technical and price signals reinforce the positive outlook, with immediate focus on the $343.00 breakout level as a potential catalyst for further gains.


Latest Texas Instruments News


-
 Afghanistan
-
 Albania
-
 Algeria
-
 Angola
-
 Argentina
-
 Armenia
-
 Australia
-
 Austria
-
 Azerbaijan
-
 Bahamas
-
 Bahrain
-
 Bangladesh
-
 Belarus
-
 Belgium
-
 Bolivia
-
 Botswana
-
 Brazil
-
 Brunei
-
 Bulgaria
-
 Cambodia
-
 Cameroon
-
 Canada
-
 Chile
Chile
-
 China
China
-
 Colombia
-
 Congo
Congo
-
 Costa Rica
-
 Cote d'Ivoire
-
 Croatia
-
 Cuba
Cuba
-
 Cyprus
-
 Czechia
-
 DR Congo
-
 Denmark
-
 Dominican Republic
-
 Ecuador
-
 Egypt
Egypt
-
 El Salvador
-
 Estonia
-
 Eswatini
-
 Ethiopia
-
 Finland
-
 France
-
 Georgia
-
 Germany
-
 Ghana
Ghana
-
 Greece
-
 Haiti
Haiti
-
 Hong Kong
-
 Hungary
-
 India
India
-
 Indonesia
-
 Iran, Islamic republic
-
 Iraq
Iraq
-
 Ireland
-
 Israel
-
 Italy
Italy
-
 Jamaica
-
 Japan
Japan
-
 Jordan
-
 Kazakhstan
-
 Kenya
Kenya
-
 Korea
Korea
-
 Kuwait
-
 Kyrgyzstan
-
 Laos
Laos
-
 Latvia
-
 Lebanon
-
 Lesotho
-
 Libya
Libya
-
 Lithuania
-
 Luxembourg
-
 Madagascar
-
 Malaysia
-
 Malta
Malta
-
 Mauritius
-
 Mexico
-
 Moldova
-
 Mongolia
-
 Montenegro
-
 Morocco
-
 Mozambique
-
 Myanmar
-
 Namibia
-
 Nepal
Nepal
-
 Netherlands
-
 New Zealand
-
 Nigeria
-
 North Macedonia
-
 Norway
-
 Oman
Oman
-
 Pakistan
-
 Palestine
-
 Panama
-
 Papua New Guinea
-
 Paraguay
-
 Peru
Peru
-
 Philippines
-
 Poland
-
 Portugal
-
 Puerto Rico
-
 Qatar
Qatar
-
 Reunion
-
 Romania
-
 Rwanda
-
 Saudi Arabia
-
 Serbia
-
 Singapore
-
 Slovakia
-
 Slovenia
-
 Somalia
-
 South Africa
-
 Spain
Spain
-
 Sri Lanka
-
 Sweden
-
 Switzerland
-
 Syria
Syria
-
 Taiwan
-
 Tajikistan
-
 Tanzania
-
 Thailand
-
 Trinidad and Tobago
-
 Tunisia
-
 Turkey
-
 UAE
UAE
-
 Uganda
-
 Ukraine
-
 United Kingdom
-
United States
-
 Uruguay
-
 Uzbekistan
-
 Venezuela
-
 Vietnam
-
 Yemen
Yemen
-
 Zambia
-
 Zimbabwe
- Forex
- Crypto
