
-3.59% for O'Reilly Automotive stock as weakness persists after a downside gap

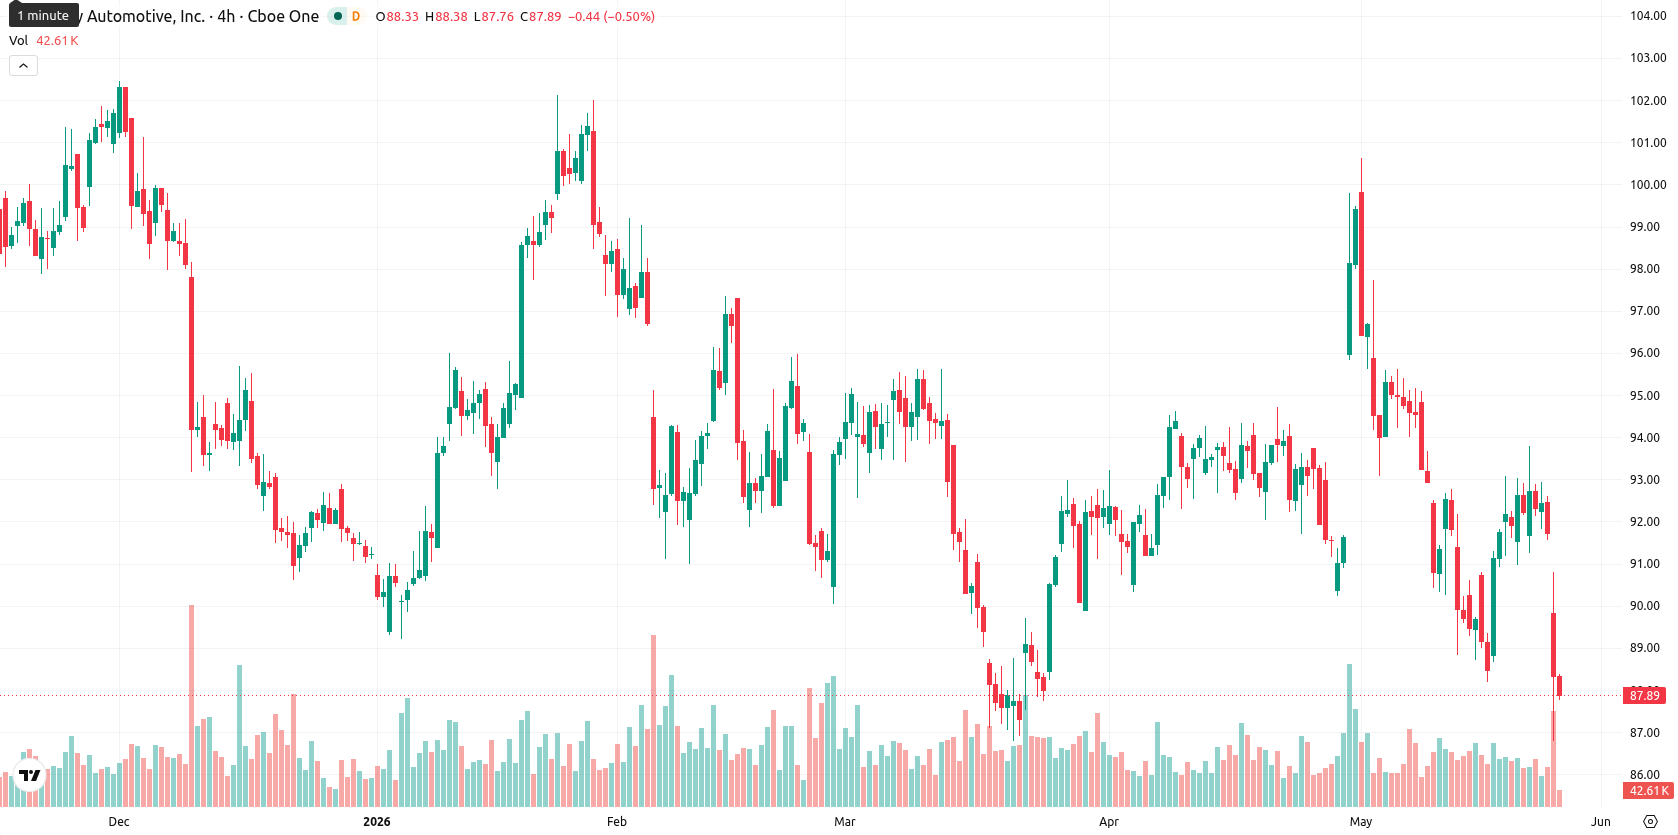
O'Reilly Automotive (ORLY) stock is trading at $88.45, representing a daily decline of 3.59%. The price remains well below its key moving averages, signaling persistent short-term and long-term selling pressure.
Highlights
- ORLY price remains under sustained selling pressure, trading below all major moving averages across multiple timeframes.
- Momentum indicators are mixed but skew bearish, with MACD signaling a sell bias and no oversold conditions present.
- Expected price range for the next five sessions is $86.50–$92.50, with downside risk prevailing unless buyers reclaim resistance at $94.34.
Technical resistance intensifies as momentum remains tepid and mixed
The $88.45 price sits significantly below the MA-20 ($92.68), MA-50 ($92.09), and MA-200 ($96.85) levels, emphasizing continued resistance at these moving average thresholds. The Ichimoku Kijun is at $94.34, marking the nearest resistance, while a downside gap from the previous close ($91.74) to today's open ($90.47) and the price currently hovering near the session low reinforce technical weakness. MACD presents a sell bias, but ADX indicates weak overall trend strength. RSI, Stoch RSI, and CCI all suggest mild to neutral downward momentum, with no clear oversold signal. BBP remains at elevated levels (0.95), highlighting that earlier buyer activity has faded as the negative tone persists. Awesome Oscillator provides no significant directional support, and intraday volatility remains moderate to high.
Further downside favored unless key resistance is breached
For the next five trading days, a range of $86.50 to $92.50 defines the typical volatility band relative to current levels. The probability of an upside move is low, making further declines more likely in the short term. The base scenario expects the price to move sideways within this corridor, while a sustained move below $86.50 would suggest additional downside risk. A bullish scenario would require a decisive break above resistance at $94.34.
Earlier, analysts noted that O'Reilly Automotive was experiencing sustained bearish momentum amid broad-based selling pressure. The current technical landscape not only reinforces this negative bias but also highlights the need to watch for a decisive move below $86.50 as a trigger for renewed downside risk.


Latest O’Reilly Automotive News


-
 Afghanistan
-
 Albania
-
 Algeria
-
 Angola
-
 Argentina
-
 Armenia
-
 Australia
-
 Austria
-
 Azerbaijan
-
 Bahamas
-
 Bahrain
-
 Bangladesh
-
 Belarus
-
 Belgium
-
 Bolivia
-
 Botswana
-
 Brazil
-
 Brunei
-
 Bulgaria
-
 Cambodia
-
 Cameroon
-
 Canada
-
 Chile
Chile
-
 China
China
-
 Colombia
-
 Congo
Congo
-
 Costa Rica
-
 Cote d'Ivoire
-
 Croatia
-
 Cuba
Cuba
-
 Cyprus
-
 Czechia
-
 DR Congo
-
 Denmark
-
 Dominican Republic
-
 Ecuador
-
 Egypt
Egypt
-
 El Salvador
-
 Estonia
-
 Eswatini
-
 Ethiopia
-
 Finland
-
 France
-
 Georgia
-
 Germany
-
 Ghana
Ghana
-
 Greece
-
 Haiti
Haiti
-
 Hong Kong
-
 Hungary
-
 India
India
-
 Indonesia
-
 Iran, Islamic republic
-
 Iraq
Iraq
-
 Ireland
-
 Israel
-
 Italy
Italy
-
 Jamaica
-
 Japan
Japan
-
 Jordan
-
 Kazakhstan
-
 Kenya
Kenya
-
 Korea
Korea
-
 Kuwait
-
 Kyrgyzstan
-
 Laos
Laos
-
 Latvia
-
 Lebanon
-
 Lesotho
-
 Libya
Libya
-
 Lithuania
-
 Luxembourg
-
 Madagascar
-
 Malaysia
-
 Malta
Malta
-
 Mauritius
-
 Mexico
-
 Moldova
-
 Mongolia
-
 Montenegro
-
 Morocco
-
 Mozambique
-
 Myanmar
-
 Namibia
-
 Nepal
Nepal
-
 Netherlands
-
 New Zealand
-
 Nigeria
-
 North Macedonia
-
 Norway
-
 Oman
Oman
-
 Pakistan
-
 Palestine
-
 Panama
-
 Papua New Guinea
-
 Paraguay
-
 Peru
Peru
-
 Philippines
-
 Poland
-
 Portugal
-
 Puerto Rico
-
 Qatar
Qatar
-
 Reunion
-
 Romania
-
 Rwanda
-
 Saudi Arabia
-
 Serbia
-
 Singapore
-
 Slovakia
-
 Slovenia
-
 Somalia
-
 South Africa
-
 Spain
Spain
-
 Sri Lanka
-
 Sweden
-
 Switzerland
-
 Syria
Syria
-
 Taiwan
-
 Tajikistan
-
 Tanzania
-
 Thailand
-
 Trinidad and Tobago
-
 Tunisia
-
 Turkey
-
 UAE
UAE
-
 Uganda
-
 Ukraine
-
 United Kingdom
-
United States
-
 Uruguay
-
 Uzbekistan
-
 Venezuela
-
 Vietnam
-
 Yemen
Yemen
-
 Zambia
-
 Zimbabwe
- Forex
- Crypto
