
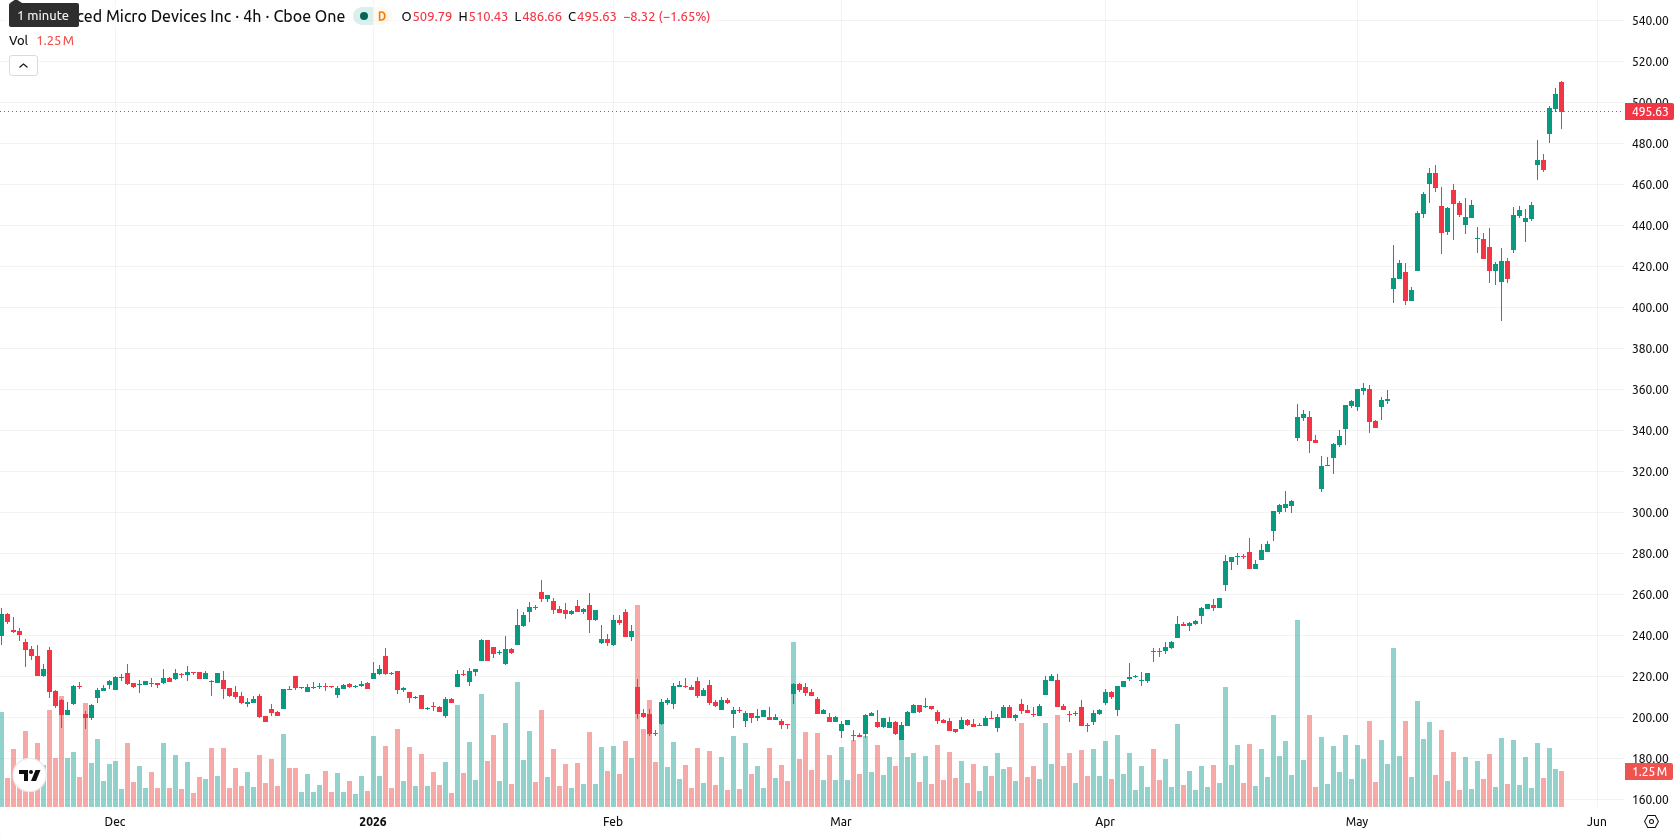
AMD stock dips as higher open reverses near $486 support

Advanced Micro Devices, Inc. (AMD) stock is trading at $495.67, down 1.77% on the day. The price remains well above its key moving averages, indicating persistent upward pressure in the short- to long-term trend.
Highlights
- AMD maintains strong bullish momentum, trading well above key moving average levels across all timeframes.
- Despite positive momentum signals, several oscillators indicate the stock is overbought, flashing caution for near-term upside.
- Price is expected to range between $486 and $525 over the next five days, with high volatility and an 80% probability of continued strength.
Overbought risk emerges as bullish momentum stays strong
SMA-20, SMA-50, and SMA-200 are positioned far below the current price at $414.39, $309.42, and $232.53, respectively, demonstrating notable separation from all major moving averages. The Ichimoku Kijun level sits at $389.40 and acts as immediate support. AMD began the session with a minor gap up, then declined to trade near the low end of today's $486.94–$508.72 range amid moderate to high intraday volatility. On the daily chart, MACD and ADX maintain strong buy signals and the Awesome Oscillator also supports ongoing bullish momentum. However, the RSI stands at 77.10 and CCI at 136.00, both indicating overbought conditions. Bull/Bear Power reflects continued buyer control while Stoch RSI is neutral, highlighting a divergence: overbought oscillators caution against continued aggressive upside even as trend indicators remain strongly positive.
High volatility range expected as breakout scenarios loom
Over the next five trading days, price action is expected within a $486 to $525 volatility band relative to current levels. The probability of continued price strength remains very high, exceeding 80%, with a less likely scenario for a near-term decline. The baseline scenario is for continued sideways movement with high volatility within the expected range. A bullish scenario could be triggered by a breakout above $525, while a move below the $486 support zone would raise the potential for a reversal following AMD's recent sharp rally.
Previously it was reported that AMD's ongoing rally was supported by strong technical momentum and favorable investor sentiment. The current analysis reinforces this outlook while noting heightened overbought conditions, with traders advised to monitor a potential breakout above $525 as the next significant catalyst.


Latest AMD News


-
 Afghanistan
-
 Albania
-
 Algeria
-
 Angola
-
 Argentina
-
 Armenia
-
 Australia
-
 Austria
-
 Azerbaijan
-
 Bahamas
-
 Bahrain
-
 Bangladesh
-
 Belarus
-
 Belgium
-
 Bolivia
-
 Botswana
-
 Brazil
-
 Brunei
-
 Bulgaria
-
 Cambodia
-
 Cameroon
-
 Canada
-
 Chile
Chile
-
 China
China
-
 Colombia
-
 Congo
Congo
-
 Costa Rica
-
 Cote d'Ivoire
-
 Croatia
-
 Cuba
Cuba
-
 Cyprus
-
 Czechia
-
 DR Congo
-
 Denmark
-
 Dominican Republic
-
 Ecuador
-
 Egypt
Egypt
-
 El Salvador
-
 Estonia
-
 Eswatini
-
 Ethiopia
-
 Finland
-
 France
-
 Georgia
-
 Germany
-
 Ghana
Ghana
-
 Greece
-
 Haiti
Haiti
-
 Hong Kong
-
 Hungary
-
 India
India
-
 Indonesia
-
 Iran, Islamic republic
-
 Iraq
Iraq
-
 Ireland
-
 Israel
-
 Italy
Italy
-
 Jamaica
-
 Japan
Japan
-
 Jordan
-
 Kazakhstan
-
 Kenya
Kenya
-
 Korea
Korea
-
 Kuwait
-
 Kyrgyzstan
-
 Laos
Laos
-
 Latvia
-
 Lebanon
-
 Lesotho
-
 Libya
Libya
-
 Lithuania
-
 Luxembourg
-
 Madagascar
-
 Malaysia
-
 Malta
Malta
-
 Mauritius
-
 Mexico
-
 Moldova
-
 Mongolia
-
 Montenegro
-
 Morocco
-
 Mozambique
-
 Myanmar
-
 Namibia
-
 Nepal
Nepal
-
 Netherlands
-
 New Zealand
-
 Nigeria
-
 North Macedonia
-
 Norway
-
 Oman
Oman
-
 Pakistan
-
 Palestine
-
 Panama
-
 Papua New Guinea
-
 Paraguay
-
 Peru
Peru
-
 Philippines
-
 Poland
-
 Portugal
-
 Puerto Rico
-
 Qatar
Qatar
-
 Reunion
-
 Romania
-
 Rwanda
-
 Saudi Arabia
-
 Serbia
-
 Singapore
-
 Slovakia
-
 Slovenia
-
 Somalia
-
 South Africa
-
 Spain
Spain
-
 Sri Lanka
-
 Sweden
-
 Switzerland
-
 Syria
Syria
-
 Taiwan
-
 Tajikistan
-
 Tanzania
-
 Thailand
-
 Trinidad and Tobago
-
 Tunisia
-
 Turkey
-
 UAE
UAE
-
 Uganda
-
 Ukraine
-
 United Kingdom
-
United States
-
 Uruguay
-
 Uzbekistan
-
 Venezuela
-
 Vietnam
-
 Yemen
Yemen
-
 Zambia
-
 Zimbabwe
- Forex
- Crypto
