
Sharp breakout drives AMD stock to solid gains on robust trading

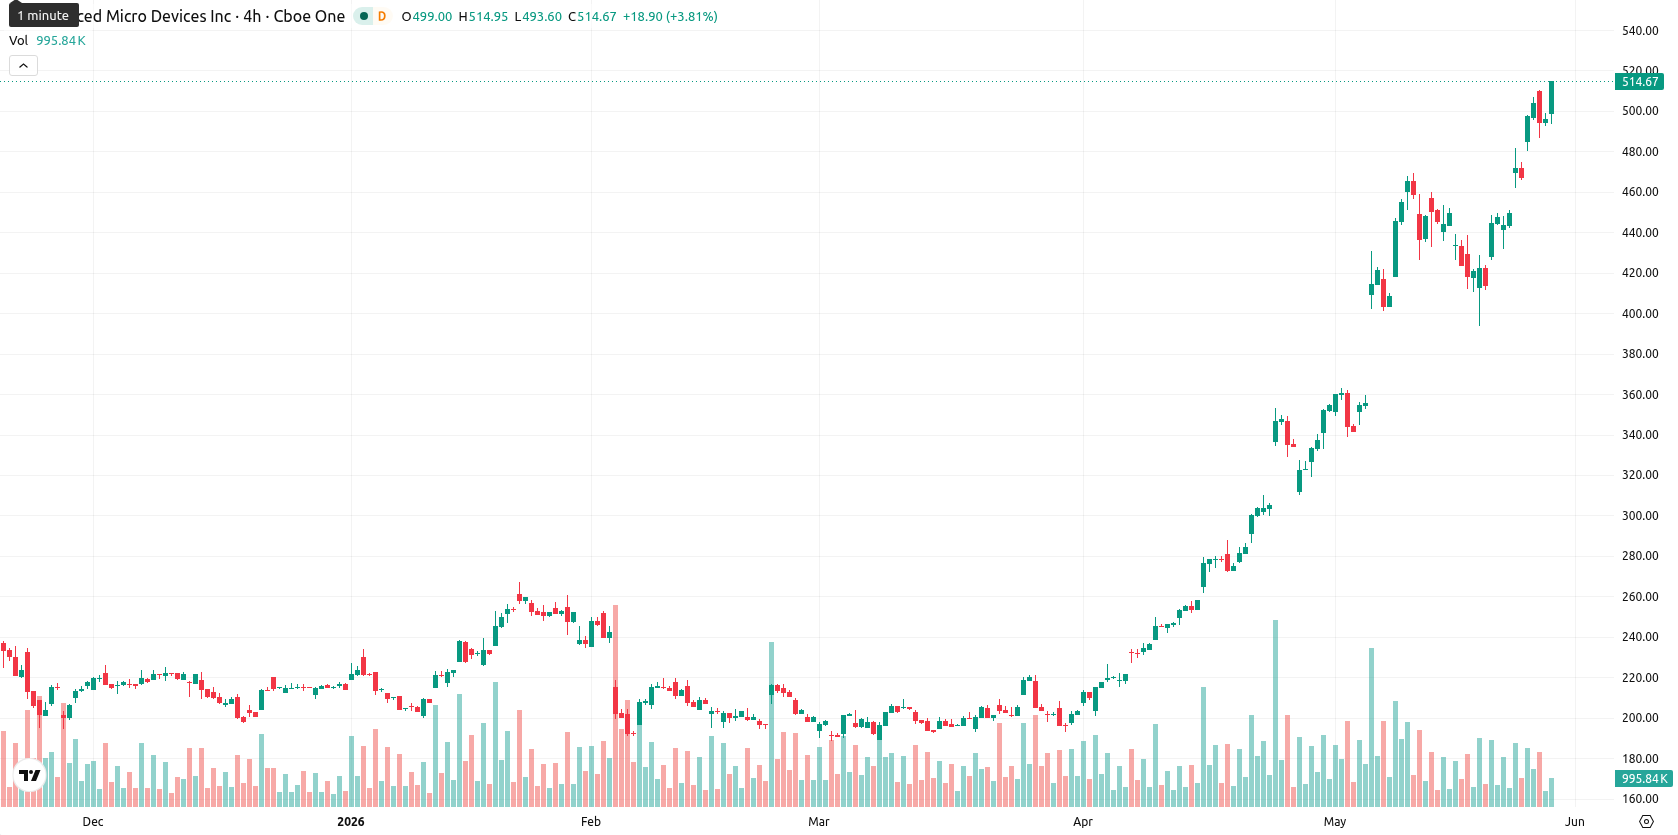
Advanced Micro Devices, Inc. (AMD) stock is trading at $516.83, up 4.20% for the day and currently positioned well above its key short-, medium-, and long-term moving averages.
Highlights
- AMD maintains a strong bullish trend with price substantially above short-, medium-, and long-term moving averages.
- Momentum and trend indicators remain bullish, but overbought oscillators reveal stretched buying conditions and possible divergence.
- Expected trading range for the coming week is $510 to $537, with an over 80% probability of continued upside barring a break below $510 support.
Overbought signals and strong momentum as price holds highs
AMD is trading above the SMA-20 ($422.99), SMA-50 ($315.39), and SMA-200 ($234.15), confirming significant separation from these technical benchmarks. Support is evident at the Ichimoku Kijun level of $392.67, while today’s upside gap began at $505.11 compared to the prior close at $496.00. Oscillator indicators show RSI at 74.20, CCI at 130.19, and both Stoch RSI and BBP are indicating overbought conditions. Momentum readings from both MACD and ADX remain bullish, while the Awesome Oscillator is consistent with ongoing upside pressure. High volatility has been observed with price holding near today’s highs, but overbought oscillator readings and stretched momentum point to growing divergence as buyers remain firmly in control.
Upside favored as bullish momentum supports consolidation at highs
For the coming week, AMD is expected to trade in a typical volatility band between $510 and $537, with a baseline scenario suggesting price will consolidate sideways near current highs. Continued buying momentum gives a high probability—greater than 80%—of further upside, particularly if price breaks above $537 and triggers follow-on buying. The bearish scenario, albeit less likely, would materialize if the stock descends below support at $510, potentially inducing a short-term correction.
Earlier, analysts noted that AMD was exhibiting sustained bullish momentum supported by robust technical indicators and persistent investor optimism. With current momentum readings and pronounced strength above key averages, traders should watch for a potential breakout above the $537 level as a catalyst for accelerated upside in the near term.


Latest AMD News


-
 Afghanistan
-
 Albania
-
 Algeria
-
 Angola
-
 Argentina
-
 Armenia
-
 Australia
-
 Austria
-
 Azerbaijan
-
 Bahamas
-
 Bahrain
-
 Bangladesh
-
 Belarus
-
 Belgium
-
 Bolivia
-
 Botswana
-
 Brazil
-
 Brunei
-
 Bulgaria
-
 Cambodia
-
 Cameroon
-
 Canada
-
 Chile
Chile
-
 China
China
-
 Colombia
-
 Congo
Congo
-
 Costa Rica
-
 Cote d'Ivoire
-
 Croatia
-
 Cuba
Cuba
-
 Cyprus
-
 Czechia
-
 DR Congo
-
 Denmark
-
 Dominican Republic
-
 Ecuador
-
 Egypt
Egypt
-
 El Salvador
-
 Estonia
-
 Eswatini
-
 Ethiopia
-
 Finland
-
 France
-
 Georgia
-
 Germany
-
 Ghana
Ghana
-
 Greece
-
 Haiti
Haiti
-
 Hong Kong
-
 Hungary
-
 India
India
-
 Indonesia
-
 Iran, Islamic republic
-
 Iraq
Iraq
-
 Ireland
-
 Israel
-
 Italy
Italy
-
 Jamaica
-
 Japan
Japan
-
 Jordan
-
 Kazakhstan
-
 Kenya
Kenya
-
 Korea
Korea
-
 Kuwait
-
 Kyrgyzstan
-
 Laos
Laos
-
 Latvia
-
 Lebanon
-
 Lesotho
-
 Libya
Libya
-
 Lithuania
-
 Luxembourg
-
 Madagascar
-
 Malaysia
-
 Malta
Malta
-
 Mauritius
-
 Mexico
-
 Moldova
-
 Mongolia
-
 Montenegro
-
 Morocco
-
 Mozambique
-
 Myanmar
-
 Namibia
-
 Nepal
Nepal
-
 Netherlands
-
 New Zealand
-
 Nigeria
-
 North Macedonia
-
 Norway
-
 Oman
Oman
-
 Pakistan
-
 Palestine
-
 Panama
-
 Papua New Guinea
-
 Paraguay
-
 Peru
Peru
-
 Philippines
-
 Poland
-
 Portugal
-
 Puerto Rico
-
 Qatar
Qatar
-
 Reunion
-
 Romania
-
 Rwanda
-
 Saudi Arabia
-
 Serbia
-
 Singapore
-
 Slovakia
-
 Slovenia
-
 Somalia
-
 South Africa
-
 Spain
Spain
-
 Sri Lanka
-
 Sweden
-
 Switzerland
-
 Syria
Syria
-
 Taiwan
-
 Tajikistan
-
 Tanzania
-
 Thailand
-
 Trinidad and Tobago
-
 Tunisia
-
 Turkey
-
 UAE
UAE
-
 Uganda
-
 Ukraine
-
 United Kingdom
-
United States
-
 Uruguay
-
 Uzbekistan
-
 Venezuela
-
 Vietnam
-
 Yemen
Yemen
-
 Zambia
-
 Zimbabwe
- Forex
- Crypto
