
Muted trading for Apple stock as $305 support level comes into focus

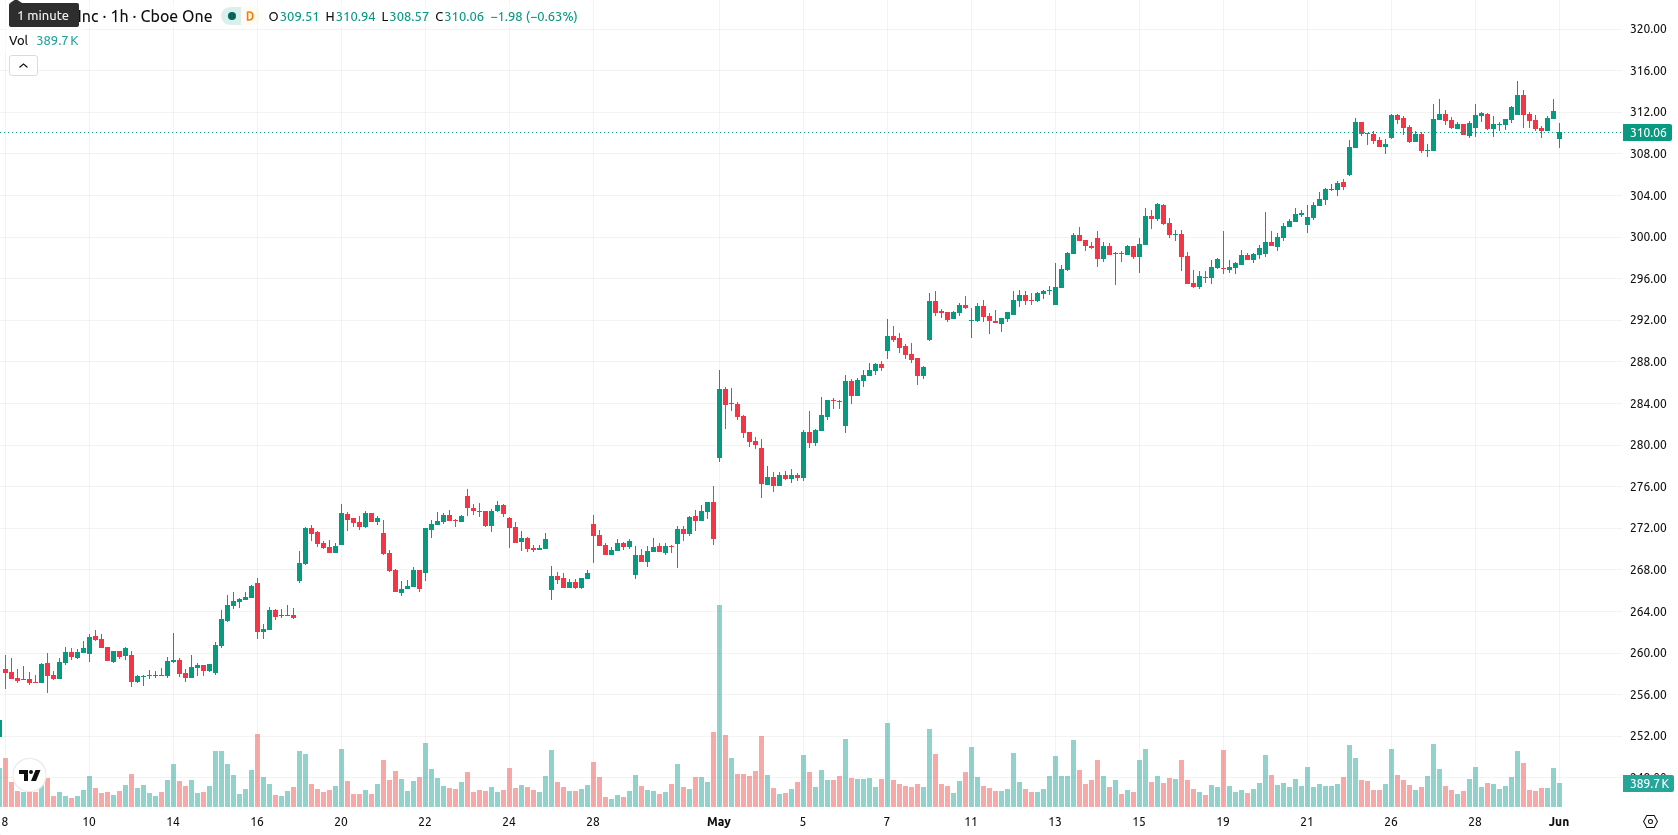
Apple Inc. (AAPL) stock is trading at $310.00, marking a daily decline of 0.48%. The price currently sits well above its key moving averages, indicating a strong underlying trend.
Highlights
- Apple maintains a strong bullish trend, trading well above short-, medium-, and long-term technical support levels.
- Momentum indicators reinforce buyer dominance, but multiple oscillators flag overbought conditions, suggesting risk of a short-term pullback.
- Expected price range for the next five days is $305.00 to $317.00, with sideways consolidation as the base scenario.
Momentum divergence emerges as oscillators flag overbought risks
Specific technical levels highlight Apple trading above the SMA-20 at $297.50, SMA-50 at $275.27, and SMA-200 at $263.23, with the Ichimoku Kijun at $289.53 serving as immediate support. Momentum indicators on the D1 timeframe are strong: both MACD and ADX favor ongoing buying, while the Awesome Oscillator also supports the prevailing bullish trend. However, oscillator readings present a more cautious picture—RSI and CCI are both indicating overbought conditions, BBP reflects persistent buyer dominance, and the Stoch RSI has shifted to a strong sell. The session displayed a small gap up at the open ($311.48 to $313.11), and price has settled near the mid-point of a moderate daily range ($309.54–$314.00). Divergence between strong trend momentum and extended oscillator readings points to potential for a short-term pullback.
Consolidation likely as volatility and overbought signals shape outlook
Looking ahead to the next five trading days, expectations center on a price range between $305.00 and $317.00, reflecting typical volatility for Apple around current levels. The baseline scenario is sideways consolidation within this band. Should bullish momentum prevail, a breakout above $317.00 is possible, while renewed intraday selling or mean reversion from overbought signals could see a dip below $305.00.
Earlier, analysts noted that Apple's rally was consolidating near highs as the market awaited confirmation of its AI-driven growth prospects. The current divergence between strong trend momentum and overbought oscillator readings signals elevated risk of a short-term pullback, making the $305–$317 range a key zone for traders to monitor over the coming sessions.


-
 Afghanistan
-
 Albania
-
 Algeria
-
 Angola
-
 Argentina
-
 Armenia
-
 Australia
-
 Austria
-
 Azerbaijan
-
 Bahamas
-
 Bahrain
-
 Bangladesh
-
 Belarus
-
 Belgium
-
 Bolivia
-
 Botswana
-
 Brazil
-
 Brunei
-
 Bulgaria
-
 Cambodia
-
 Cameroon
-
 Canada
-
 Chile
Chile
-
 China
China
-
 Colombia
-
 Congo
Congo
-
 Costa Rica
-
 Cote d'Ivoire
-
 Croatia
-
 Cuba
Cuba
-
 Cyprus
-
 Czechia
-
 DR Congo
-
 Denmark
-
 Dominican Republic
-
 Ecuador
-
 Egypt
Egypt
-
 El Salvador
-
 Estonia
-
 Eswatini
-
 Ethiopia
-
 Finland
-
 France
-
 Georgia
-
 Germany
-
 Ghana
Ghana
-
 Greece
-
 Haiti
Haiti
-
 Hong Kong
-
 Hungary
-
 India
India
-
 Indonesia
-
 Iran, Islamic republic
-
 Iraq
Iraq
-
 Ireland
-
 Israel
-
 Italy
Italy
-
 Jamaica
-
 Japan
Japan
-
 Jordan
-
 Kazakhstan
-
 Kenya
Kenya
-
 Korea
Korea
-
 Kuwait
-
 Kyrgyzstan
-
 Laos
Laos
-
 Latvia
-
 Lebanon
-
 Lesotho
-
 Libya
Libya
-
 Lithuania
-
 Luxembourg
-
 Madagascar
-
 Malaysia
-
 Malta
Malta
-
 Mauritius
-
 Mexico
-
 Moldova
-
 Mongolia
-
 Montenegro
-
 Morocco
-
 Mozambique
-
 Myanmar
-
 Namibia
-
 Nepal
Nepal
-
 Netherlands
-
 New Zealand
-
 Nigeria
-
 North Macedonia
-
 Norway
-
 Oman
Oman
-
 Pakistan
-
 Palestine
-
 Panama
-
 Papua New Guinea
-
 Paraguay
-
 Peru
Peru
-
 Philippines
-
 Poland
-
 Portugal
-
 Puerto Rico
-
 Qatar
Qatar
-
 Reunion
-
 Romania
-
 Rwanda
-
 Saudi Arabia
-
 Serbia
-
 Singapore
-
 Slovakia
-
 Slovenia
-
 Somalia
-
 South Africa
-
 Spain
Spain
-
 Sri Lanka
-
 Sweden
-
 Switzerland
-
 Syria
Syria
-
 Taiwan
-
 Tajikistan
-
 Tanzania
-
 Thailand
-
 Trinidad and Tobago
-
 Tunisia
-
 Turkey
-
 UAE
UAE
-
 Uganda
-
 Ukraine
-
 United Kingdom
-
United States
-
 Uruguay
-
 Uzbekistan
-
 Venezuela
-
 Vietnam
-
 Yemen
Yemen
-
 Zambia
-
 Zimbabwe
- Forex
- Crypto
