
Persistent trading well under average drags Bit Digital stock lower

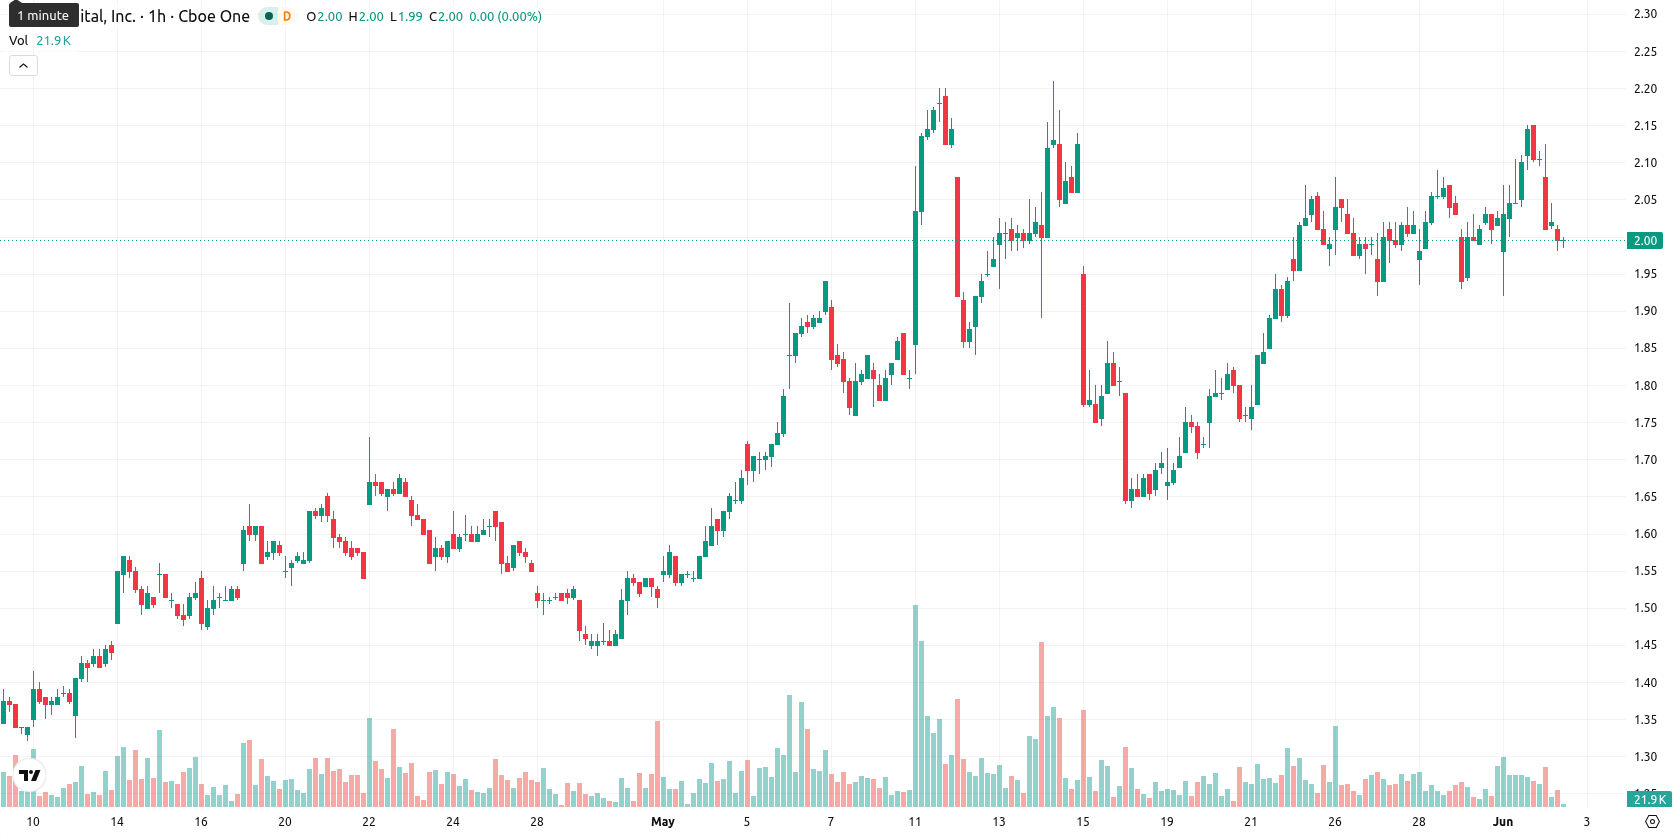
Bit Digital Inc. (BTBT) stock is trading at $1.98, marking a decline of 6.16% on the day. The share price stands above its short- and medium-term moving averages, while remaining below key longer-term averages.
Highlights
- BTBT trades above short- and medium-term moving averages, indicating a bullish trend in the near term despite long-term resistance.
- Daily momentum indicators mostly favor buyers, but a sharp 6.16% intraday decline creates a short-term divergence between price action and technical signals.
- Price is expected to remain volatile and rangebound between $1.90 and $2.15, with further downside favored unless $2.15 is surpassed on strong volume.
Buy momentum builds despite volatility and resistance from SMA-200
On the technical side, BTBT is currently positioned above the SMA-20 ($1.92) and SMA-50 ($1.65), but remains below the longer-term SMA-200 at $2.31. The Ichimoku Kijun indicator provides immediate support at $1.83, with intraday trading exhibiting notable volatility. Momentum readings are mixed: MACD and ADX signal underlying buy strength; RSI is at 62.49 and CCI at 92.27, both pointing to bullish momentum, yet neither is overbought. Stoch RSI reads neutral and the BBP indicator shows strong buyer dominance at the intraday level, while the Awesome Oscillator remains neutral. The current range for the day spans from $1.98 to $2.13, with trading now near the session's low, evidencing enduring downside pressure.
Limited breakout risk as price consolidates within volatile range
Over the coming week, BTBT is expected to trade in a $1.90–$2.15 range, consistent with recent volatility and price levels. The likelihood of an upward breakout is low (less than 20%), making a decline or rangebound movement the baseline scenario. A break above $2.15 could trigger renewed bullish momentum if matched by an uptick in volume and momentum indicators, while a drop below $1.90 would open the door for increased seller dominance and possible further declines.
Earlier, analysts noted that Bit Digital was displaying signs of consolidation with upward momentum limited by longer-term resistance. With the current decline and increasing intraday volatility, traders should closely watch for a move below $1.90 as a potential signal for increased downside risk.


Latest Bit Digital News


-
 Afghanistan
-
 Albania
-
 Algeria
-
 Angola
-
 Argentina
-
 Armenia
-
 Australia
-
 Austria
-
 Azerbaijan
-
 Bahamas
-
 Bahrain
-
 Bangladesh
-
 Belarus
-
 Belgium
-
 Bolivia
-
 Botswana
-
 Brazil
-
 Brunei
-
 Bulgaria
-
 Cambodia
-
 Cameroon
-
 Canada
-
 Chile
Chile
-
 China
China
-
 Colombia
-
 Congo
Congo
-
 Costa Rica
-
 Cote d'Ivoire
-
 Croatia
-
 Cuba
Cuba
-
 Cyprus
-
 Czechia
-
 DR Congo
-
 Denmark
-
 Dominican Republic
-
 Ecuador
-
 Egypt
Egypt
-
 El Salvador
-
 Estonia
-
 Eswatini
-
 Ethiopia
-
 Finland
-
 France
-
 Georgia
-
 Germany
-
 Ghana
Ghana
-
 Greece
-
 Haiti
Haiti
-
 Hong Kong
-
 Hungary
-
 India
India
-
 Indonesia
-
 Iran, Islamic republic
-
 Iraq
Iraq
-
 Ireland
-
 Israel
-
 Italy
Italy
-
 Jamaica
-
 Japan
Japan
-
 Jordan
-
 Kazakhstan
-
 Kenya
Kenya
-
 Korea
Korea
-
 Kuwait
-
 Kyrgyzstan
-
 Laos
Laos
-
 Latvia
-
 Lebanon
-
 Lesotho
-
 Libya
Libya
-
 Lithuania
-
 Luxembourg
-
 Madagascar
-
 Malaysia
-
 Malta
Malta
-
 Mauritius
-
 Mexico
-
 Moldova
-
 Mongolia
-
 Montenegro
-
 Morocco
-
 Mozambique
-
 Myanmar
-
 Namibia
-
 Nepal
Nepal
-
 Netherlands
-
 New Zealand
-
 Nigeria
-
 North Macedonia
-
 Norway
-
 Oman
Oman
-
 Pakistan
-
 Palestine
-
 Panama
-
 Papua New Guinea
-
 Paraguay
-
 Peru
Peru
-
 Philippines
-
 Poland
-
 Portugal
-
 Puerto Rico
-
 Qatar
Qatar
-
 Reunion
-
 Romania
-
 Rwanda
-
 Saudi Arabia
-
 Serbia
-
 Singapore
-
 Slovakia
-
 Slovenia
-
 Somalia
-
 South Africa
-
 Spain
Spain
-
 Sri Lanka
-
 Sweden
-
 Switzerland
-
 Syria
Syria
-
 Taiwan
-
 Tajikistan
-
 Tanzania
-
 Thailand
-
 Trinidad and Tobago
-
 Tunisia
-
 Turkey
-
 UAE
UAE
-
 Uganda
-
 Ukraine
-
 United Kingdom
-
United States
-
 Uruguay
-
 Uzbekistan
-
 Venezuela
-
 Vietnam
-
 Yemen
Yemen
-
 Zambia
-
 Zimbabwe
- Forex
- Crypto
