
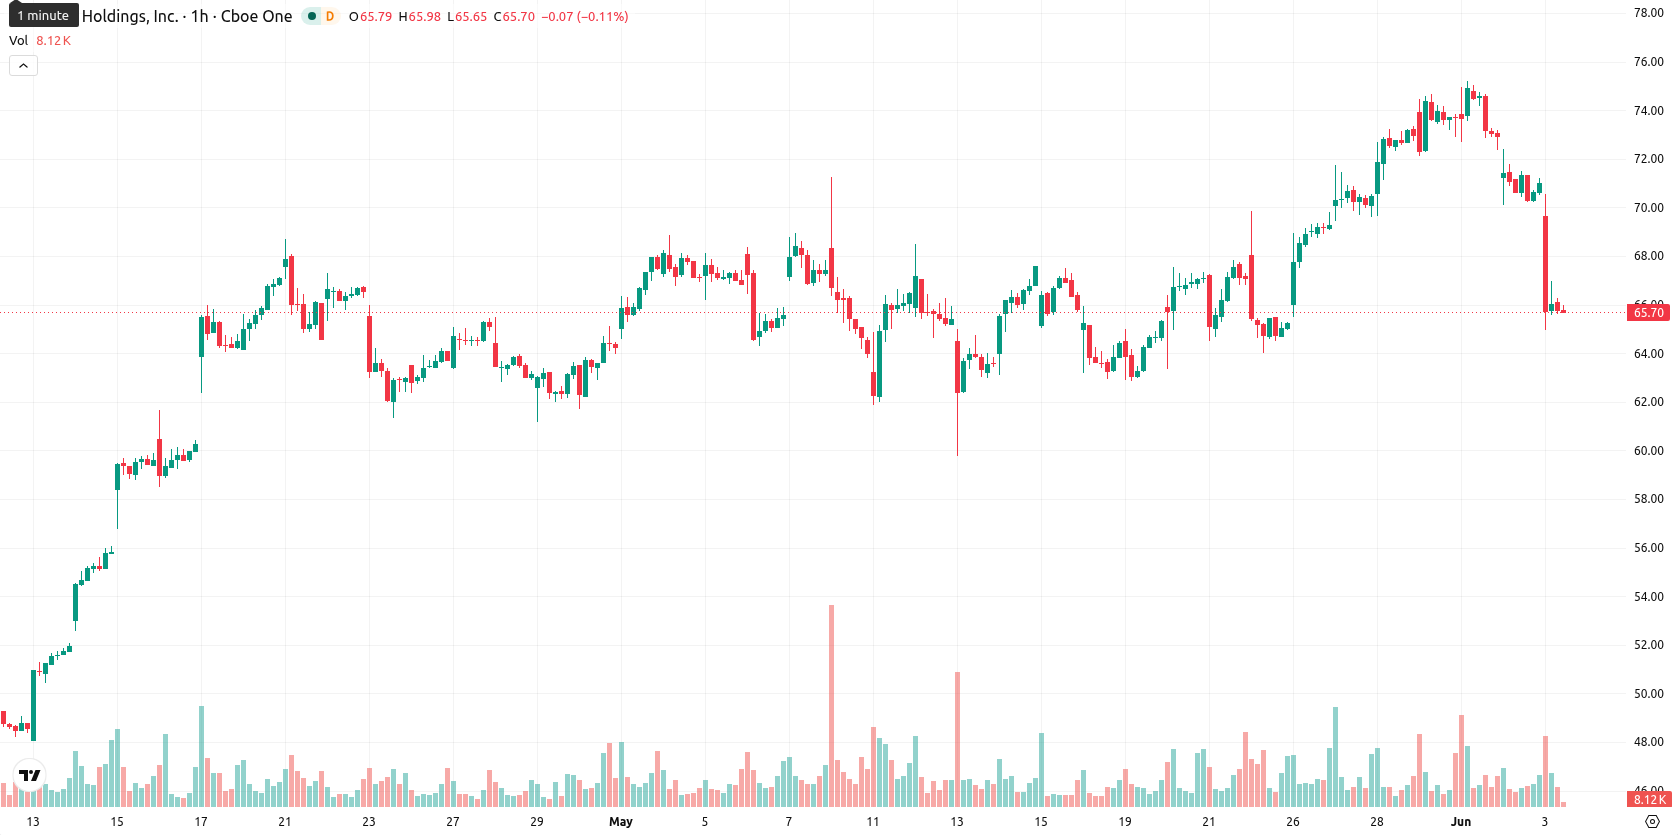
Affirm stock tumbles as short-term trend shifts to bearish near $65 support

Affirm Holdings, Inc. (AFRM) stock is trading at $66.01 after a sharp daily decline of 7.04%. The price currently sits just below its short- and long-term moving averages, while remaining well above the medium-term trend, highlighting ongoing volatility and a shift in near-term positioning.
Highlights
- AFRM trades below short- and long-term moving averages, indicating near-term selling pressure despite medium-term bullish undercurrents.
- Momentum indicators signal mild overbought conditions with weakening bullish momentum, highlighting increased uncertainty and volatility.
- Bearish bias dominates with an expected price range of $63.00–$69.00; further declines are more likely unless $67.50–$69.00 resistance breaks.
Mixed momentum and resistance cluster signal uncertain direction
AFRM is consolidating between distinct technical zones. The stock is trading just under the SMA-20 ($67.60) and SMA-200 ($67.31), while maintaining a substantial margin above the SMA-50 ($60.12). The Ichimoku Kijun level at $67.49 remains the closest resistance on the daily timeframe. Intraday volatility has been high, with the session opening at $69.64 before dropping sharply towards a low of $65.00. Momentum signals are mixed: MACD maintains a bullish stance but the ADX is neutral and signals weak trend strength. Daily RSI at 60.18 and CCI at 102.23 both indicate mild overbought territory, while Stochastic RSI shows neutral conditions. BBP identifies the market as overbought, but the recent downside and waning oscillator momentum highlight uncertainty and a weakening grip by buyers.
Further downside risk as rangebound volatility limits recovery
In the near-term, AFRM is expected to trade in a volatility band between $63.00 and $69.00, reflecting current uncertainty. The probability of a price increase remains low, while the dominant scenario projects further pressure or sideways consolidation within this range. A clear bullish reversal would require a firm move above $67.50–$69.00, leading to a retest of recent highs. Should AFRM fall below $65.00, the risk of a deeper correction increases if selling activity persists.
Earlier, analysts noted that Affirm Holdings’ technical resilience and increasing institutional participation supported a constructive outlook despite episodes of volatility. The latest breakdown below key moving averages introduces a new downside risk, making sustained action above $67.50 crucial for any meaningful reversal in the upcoming sessions.


-
 Afghanistan
-
 Albania
-
 Algeria
-
 Angola
-
 Argentina
-
 Armenia
-
 Australia
-
 Austria
-
 Azerbaijan
-
 Bahamas
-
 Bahrain
-
 Bangladesh
-
 Belarus
-
 Belgium
-
 Bolivia
-
 Botswana
-
 Brazil
-
 Brunei
-
 Bulgaria
-
 Cambodia
-
 Cameroon
-
 Canada
-
 Chile
Chile
-
 China
China
-
 Colombia
-
 Congo
Congo
-
 Costa Rica
-
 Cote d'Ivoire
-
 Croatia
-
 Cuba
Cuba
-
 Cyprus
-
 Czechia
-
 DR Congo
-
 Denmark
-
 Dominican Republic
-
 Ecuador
-
 Egypt
Egypt
-
 El Salvador
-
 Estonia
-
 Eswatini
-
 Ethiopia
-
 Finland
-
 France
-
 Georgia
-
 Germany
-
 Ghana
Ghana
-
 Greece
-
 Haiti
Haiti
-
 Hong Kong
-
 Hungary
-
 India
India
-
 Indonesia
-
 Iran, Islamic republic
-
 Iraq
Iraq
-
 Ireland
-
 Israel
-
 Italy
Italy
-
 Jamaica
-
 Japan
Japan
-
 Jordan
-
 Kazakhstan
-
 Kenya
Kenya
-
 Korea
Korea
-
 Kuwait
-
 Kyrgyzstan
-
 Laos
Laos
-
 Latvia
-
 Lebanon
-
 Lesotho
-
 Libya
Libya
-
 Lithuania
-
 Luxembourg
-
 Madagascar
-
 Malaysia
-
 Malta
Malta
-
 Mauritius
-
 Mexico
-
 Moldova
-
 Mongolia
-
 Montenegro
-
 Morocco
-
 Mozambique
-
 Myanmar
-
 Namibia
-
 Nepal
Nepal
-
 Netherlands
-
 New Zealand
-
 Nigeria
-
 North Macedonia
-
 Norway
-
 Oman
Oman
-
 Pakistan
-
 Palestine
-
 Panama
-
 Papua New Guinea
-
 Paraguay
-
 Peru
Peru
-
 Philippines
-
 Poland
-
 Portugal
-
 Puerto Rico
-
 Qatar
Qatar
-
 Reunion
-
 Romania
-
 Rwanda
-
 Saudi Arabia
-
 Serbia
-
 Singapore
-
 Slovakia
-
 Slovenia
-
 Somalia
-
 South Africa
-
 Spain
Spain
-
 Sri Lanka
-
 Sweden
-
 Switzerland
-
 Syria
Syria
-
 Taiwan
-
 Tajikistan
-
 Tanzania
-
 Thailand
-
 Trinidad and Tobago
-
 Tunisia
-
 Turkey
-
 UAE
UAE
-
 Uganda
-
 Ukraine
-
 United Kingdom
-
United States
-
 Uruguay
-
 Uzbekistan
-
 Venezuela
-
 Vietnam
-
 Yemen
Yemen
-
 Zambia
-
 Zimbabwe
- Forex
- Crypto
