

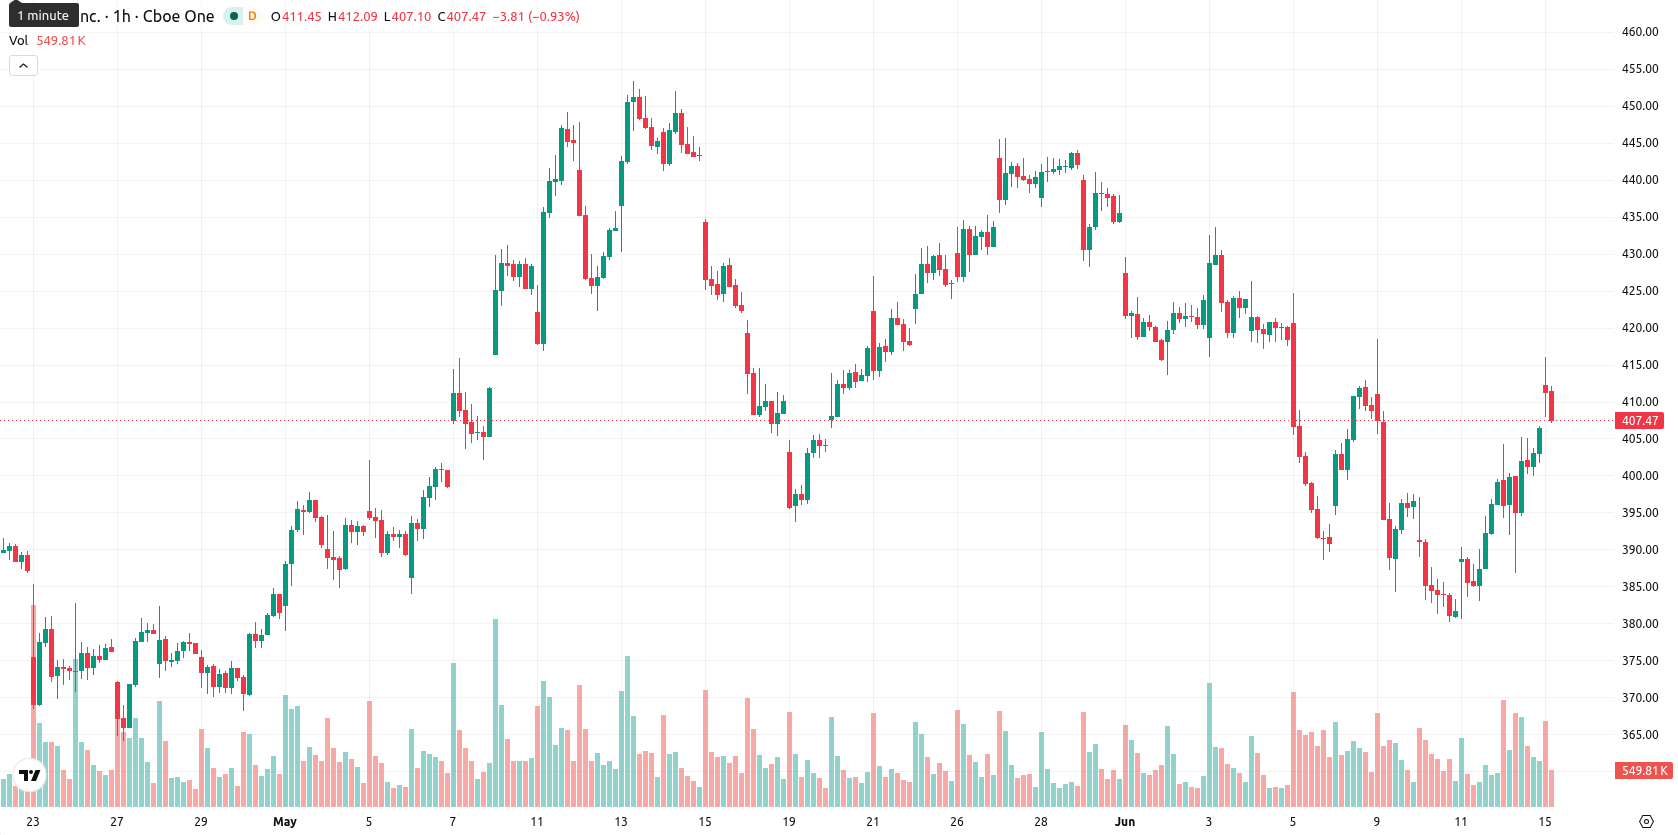
Tesla, Inc. (TSLA) stock is trading at $411.46, marking a daily increase of 1.52%. The stock currently sits above its key moving averages on the shorter timeframes, indicating positive near-term momentum.
Highlights
- Sustained institutional buying of Tesla by ARK Invest in 2026 drives increased liquidity and supports ongoing bullish sentiment.
- Speculation around a potential Tesla–SpaceX merger and EU regulatory scrutiny of FSD create both upside catalysts and expansion uncertainty.
- TSLA is expected to remain between $394.31 and $428.61 over the next few sessions, with mixed technical signals suggesting moderate upside risk but overbought buying conditions.
Institutional inflows and merger speculation as sentiment drivers amid regulatory scrutiny
ARK Invest's repeated purchases of Tesla stock throughout 2026 underline robust institutional demand and add direct liquidity to the market, supporting recent buying momentum. Additional speculation of a potential merger between Tesla and SpaceX, fueled by the latter’s recent IPO and public statements from SpaceX leadership, further stirs investor interest and encourages broader participation. In regulatory news, Tesla has submitted self-published Full Self-Driving safety data to European authorities, though mixed reactions from traffic-safety researchers add a degree of uncertainty around expansion efforts. These developments together shape a complex backdrop in which ongoing institutional inflows and corporate initiatives play crucial roles in driving near-term sentiment.
Mixed momentum signals as TSLA tests technical boundaries and support
On the technical front, TSLA trades above its MA-20 and MA-50 on the hourly chart, while it remains below the MA-200 on the daily, reflecting conflicting signals across timeframes. Immediate support is established at the Ichimoku Kijun level of $393.42. Momentum indicators are mixed: MACD and Awesome Oscillator show buyer dominance, though ADX reads neutral. RSI is bullish near 61, while Stoch RSI, CCI, and Bull/Bear Power all indicate overbought conditions. Current price action shows TSLA opening with a 5.85 gap and holding near today’s high amidst low intraday volatility, highlighting strong buying activity even as some oscillators signal stretched conditions.
Upward bias moderates as TSLA navigates key volatility range
Over the next 2–3 trading days, TSLA is likely to oscillate within a typical volatility band between $394.31 and $428.61. There is a moderately higher chance for upward continuation, with a 57% probability for an advance; however, a downside move cannot be ruled out. If TSLA stays within this range, further sideways movement is expected. A break above $428.61 would signal fresh bullish momentum, while a fall below support could mark a short-term shift to bearish sentiment.
Earlier, analysts noted that Tesla’s long-term valuation remains closely tied to its progress in autonomous driving technology and the broader market’s confidence in its future commercial viability. Current momentum, buoyed by sustained institutional inflows and merger speculation, adds new catalysts to the narrative—placing particular emphasis on how TSLA behaves if it tests the $428.61 resistance, where a confirmed breakout could significantly shift sentiment in favor of bulls.


Latest Tesla News


-
 Afghanistan
-
 Albania
-
 Algeria
-
 Angola
-
 Argentina
-
 Armenia
-
 Australia
-
 Austria
-
 Azerbaijan
-
 Bahamas
-
 Bahrain
-
 Bangladesh
-
 Belarus
-
 Belgium
-
 Bolivia
-
 Botswana
-
 Brazil
-
 Brunei
-
 Bulgaria
-
 Cambodia
-
 Cameroon
-
 Canada
-
 Chile
Chile
-
 China
China
-
 Colombia
-
 Congo
Congo
-
 Costa Rica
-
 Cote d'Ivoire
-
 Croatia
-
 Cuba
Cuba
-
 Cyprus
-
 Czechia
-
 DR Congo
-
 Denmark
-
 Dominican Republic
-
 Ecuador
-
 Egypt
Egypt
-
 El Salvador
-
 Estonia
-
 Eswatini
-
 Ethiopia
-
 Finland
-
 France
-
 Georgia
-
 Germany
-
 Ghana
Ghana
-
 Greece
-
 Haiti
Haiti
-
 Hong Kong
-
 Hungary
-
 India
India
-
 Indonesia
-
 Iran, Islamic republic
-
 Iraq
Iraq
-
 Ireland
-
 Israel
-
 Italy
Italy
-
 Jamaica
-
 Japan
Japan
-
 Jordan
-
 Kazakhstan
-
 Kenya
Kenya
-
 Korea
Korea
-
 Kuwait
-
 Kyrgyzstan
-
 Laos
Laos
-
 Latvia
-
 Lebanon
-
 Lesotho
-
 Libya
Libya
-
 Lithuania
-
 Luxembourg
-
 Madagascar
-
 Malaysia
-
 Malta
Malta
-
 Mauritius
-
 Mexico
-
 Moldova
-
 Mongolia
-
 Montenegro
-
 Morocco
-
 Mozambique
-
 Myanmar
-
 Namibia
-
 Nepal
Nepal
-
 Netherlands
-
 New Zealand
-
 Nigeria
-
 North Macedonia
-
 Norway
-
 Oman
Oman
-
 Pakistan
-
 Palestine
-
 Panama
-
 Papua New Guinea
-
 Paraguay
-
 Peru
Peru
-
 Philippines
-
 Poland
-
 Portugal
-
 Puerto Rico
-
 Qatar
Qatar
-
 Reunion
-
 Romania
-
 Rwanda
-
 Saudi Arabia
-
 Serbia
-
 Singapore
-
 Slovakia
-
 Slovenia
-
 Somalia
-
 South Africa
-
 Spain
Spain
-
 Sri Lanka
-
 Sweden
-
 Switzerland
-
 Syria
Syria
-
 Taiwan
-
 Tajikistan
-
 Tanzania
-
 Thailand
-
 Trinidad and Tobago
-
 Tunisia
-
 Turkey
-
 UAE
UAE
-
 Uganda
-
 Ukraine
-
 United Kingdom
-
United States
-
 Uruguay
-
 Uzbekistan
-
 Venezuela
-
 Vietnam
-
 Yemen
Yemen
-
 Zambia
-
 Zimbabwe
- Forex
- Crypto
